NASA - National Aeronautics and Space Administration
+ Contact NASA
 

Directory Listing -- diffuse

CERES Satellite to Ground-Site Validation Plots

These plots were generated using data ordered from the CERES SYN1deg Ed4.2 data ordering tool. For each site, hourly data from the full available time range (March 1, 2000 through April 30, 2026) was downloaded. After each site’s data file (in netCDF format) was received, a Python program separated the data into monthly netCDF files. A second Python program then used these monthly files to create four graph types (downwelling longwave, downwelling shortwave diffuse, downwelling shortwave direct, and downwelling shortwave global) for each month, year, and site. Each plot compares the observed radiation values to the corresponding SYN1deg values.

Note: Some ground-truth validation sites have not been operational for the entire timeline of CERES satellite data collection (2000-2026). If only one line appears on the comparison plot, it is likely because there was no ground-truth data for that specific month.


‹‹‹‹ Back One   - history -    Forward One ››››

+ Return to the CERES Radiation Validation Experiment (CRAVE) Home Page

To download a file right click on its link and select save.


Files in this folder: Size (bytes): Modified:
+ ny_alesund_nw-2013-12-diffuse.jpg 140811 2026-08-03 20:00pm
+ ny_alesund_nw-2013-11-diffuse.jpg 140180 2026-08-03 20:00pm
+ ny_alesund_nw-2013-10-diffuse.jpg 169709 2026-08-03 20:00pm
+ ny_alesund_nw-2013-09-diffuse.jpg 200353 2026-08-03 20:00pm
+ ny_alesund_nw-2013-08-diffuse.jpg 222937 2026-08-03 20:00pm
+ ny_alesund_nw-2013-07-diffuse.jpg 223941 2026-08-03 20:00pm
+ ny_alesund_nw-2013-06-diffuse.jpg 222870 2026-08-03 19:59pm
+ ny_alesund_nw-2013-05-diffuse.jpg 222217 2026-08-03 19:59pm
+ ny_alesund_nw-2013-04-diffuse.jpg 210954 2026-08-03 19:59pm
+ ny_alesund_nw-2013-03-diffuse.jpg 189555 2026-08-03 19:59pm
+ ny_alesund_nw-2013-02-diffuse.jpg 150624 2026-08-03 19:59pm
+ ny_alesund_nw-2013-01-diffuse.jpg 140878 2026-08-03 19:59pm


BSRN-LRC-49

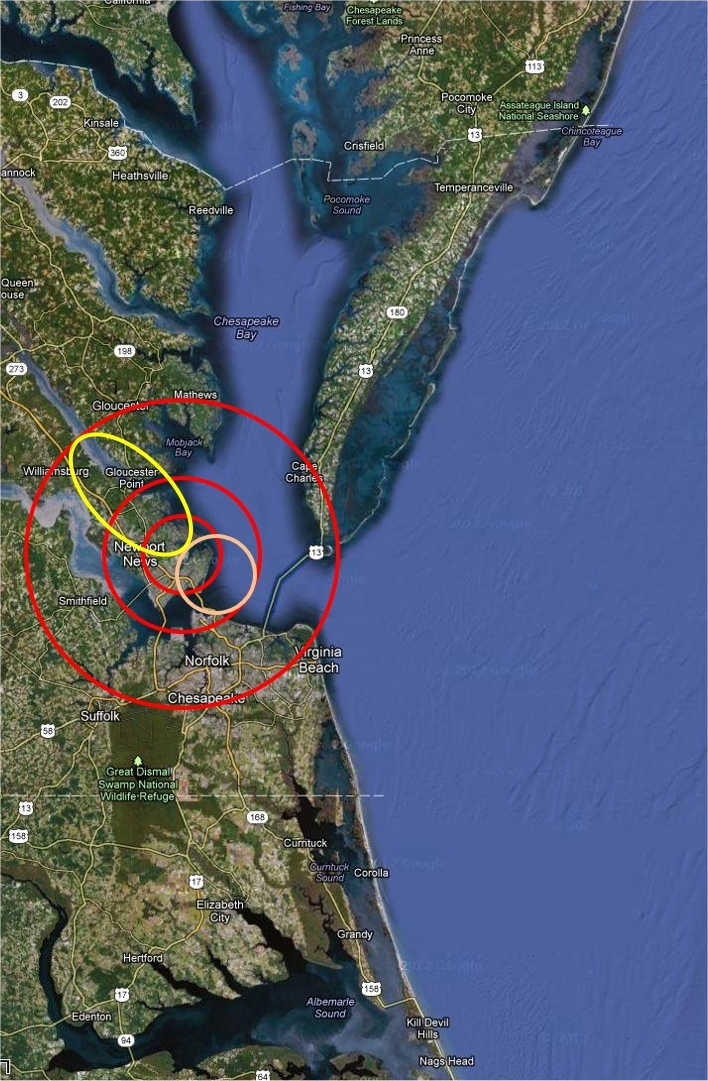
Large area view.

Latitude: 37.1038
Longitude: -76.3872
Elevation: 3 m Above sea level

Scenes: urban, marsh, bay, river and farm.

Legend

  • The inner red circle is a 20km CERES foot print centered on the BSRN-LRC site.
  • The pink circle represents a possible tangential 20km foot print.
  • The middle red circle represents the area in which a 20km foot print could fall and still see the site.
  • Yellow is a sample 40 deg off nadir foot print.
  • The outer red circle is the region which would be seen by a possible 40 deg off nadir foot print.
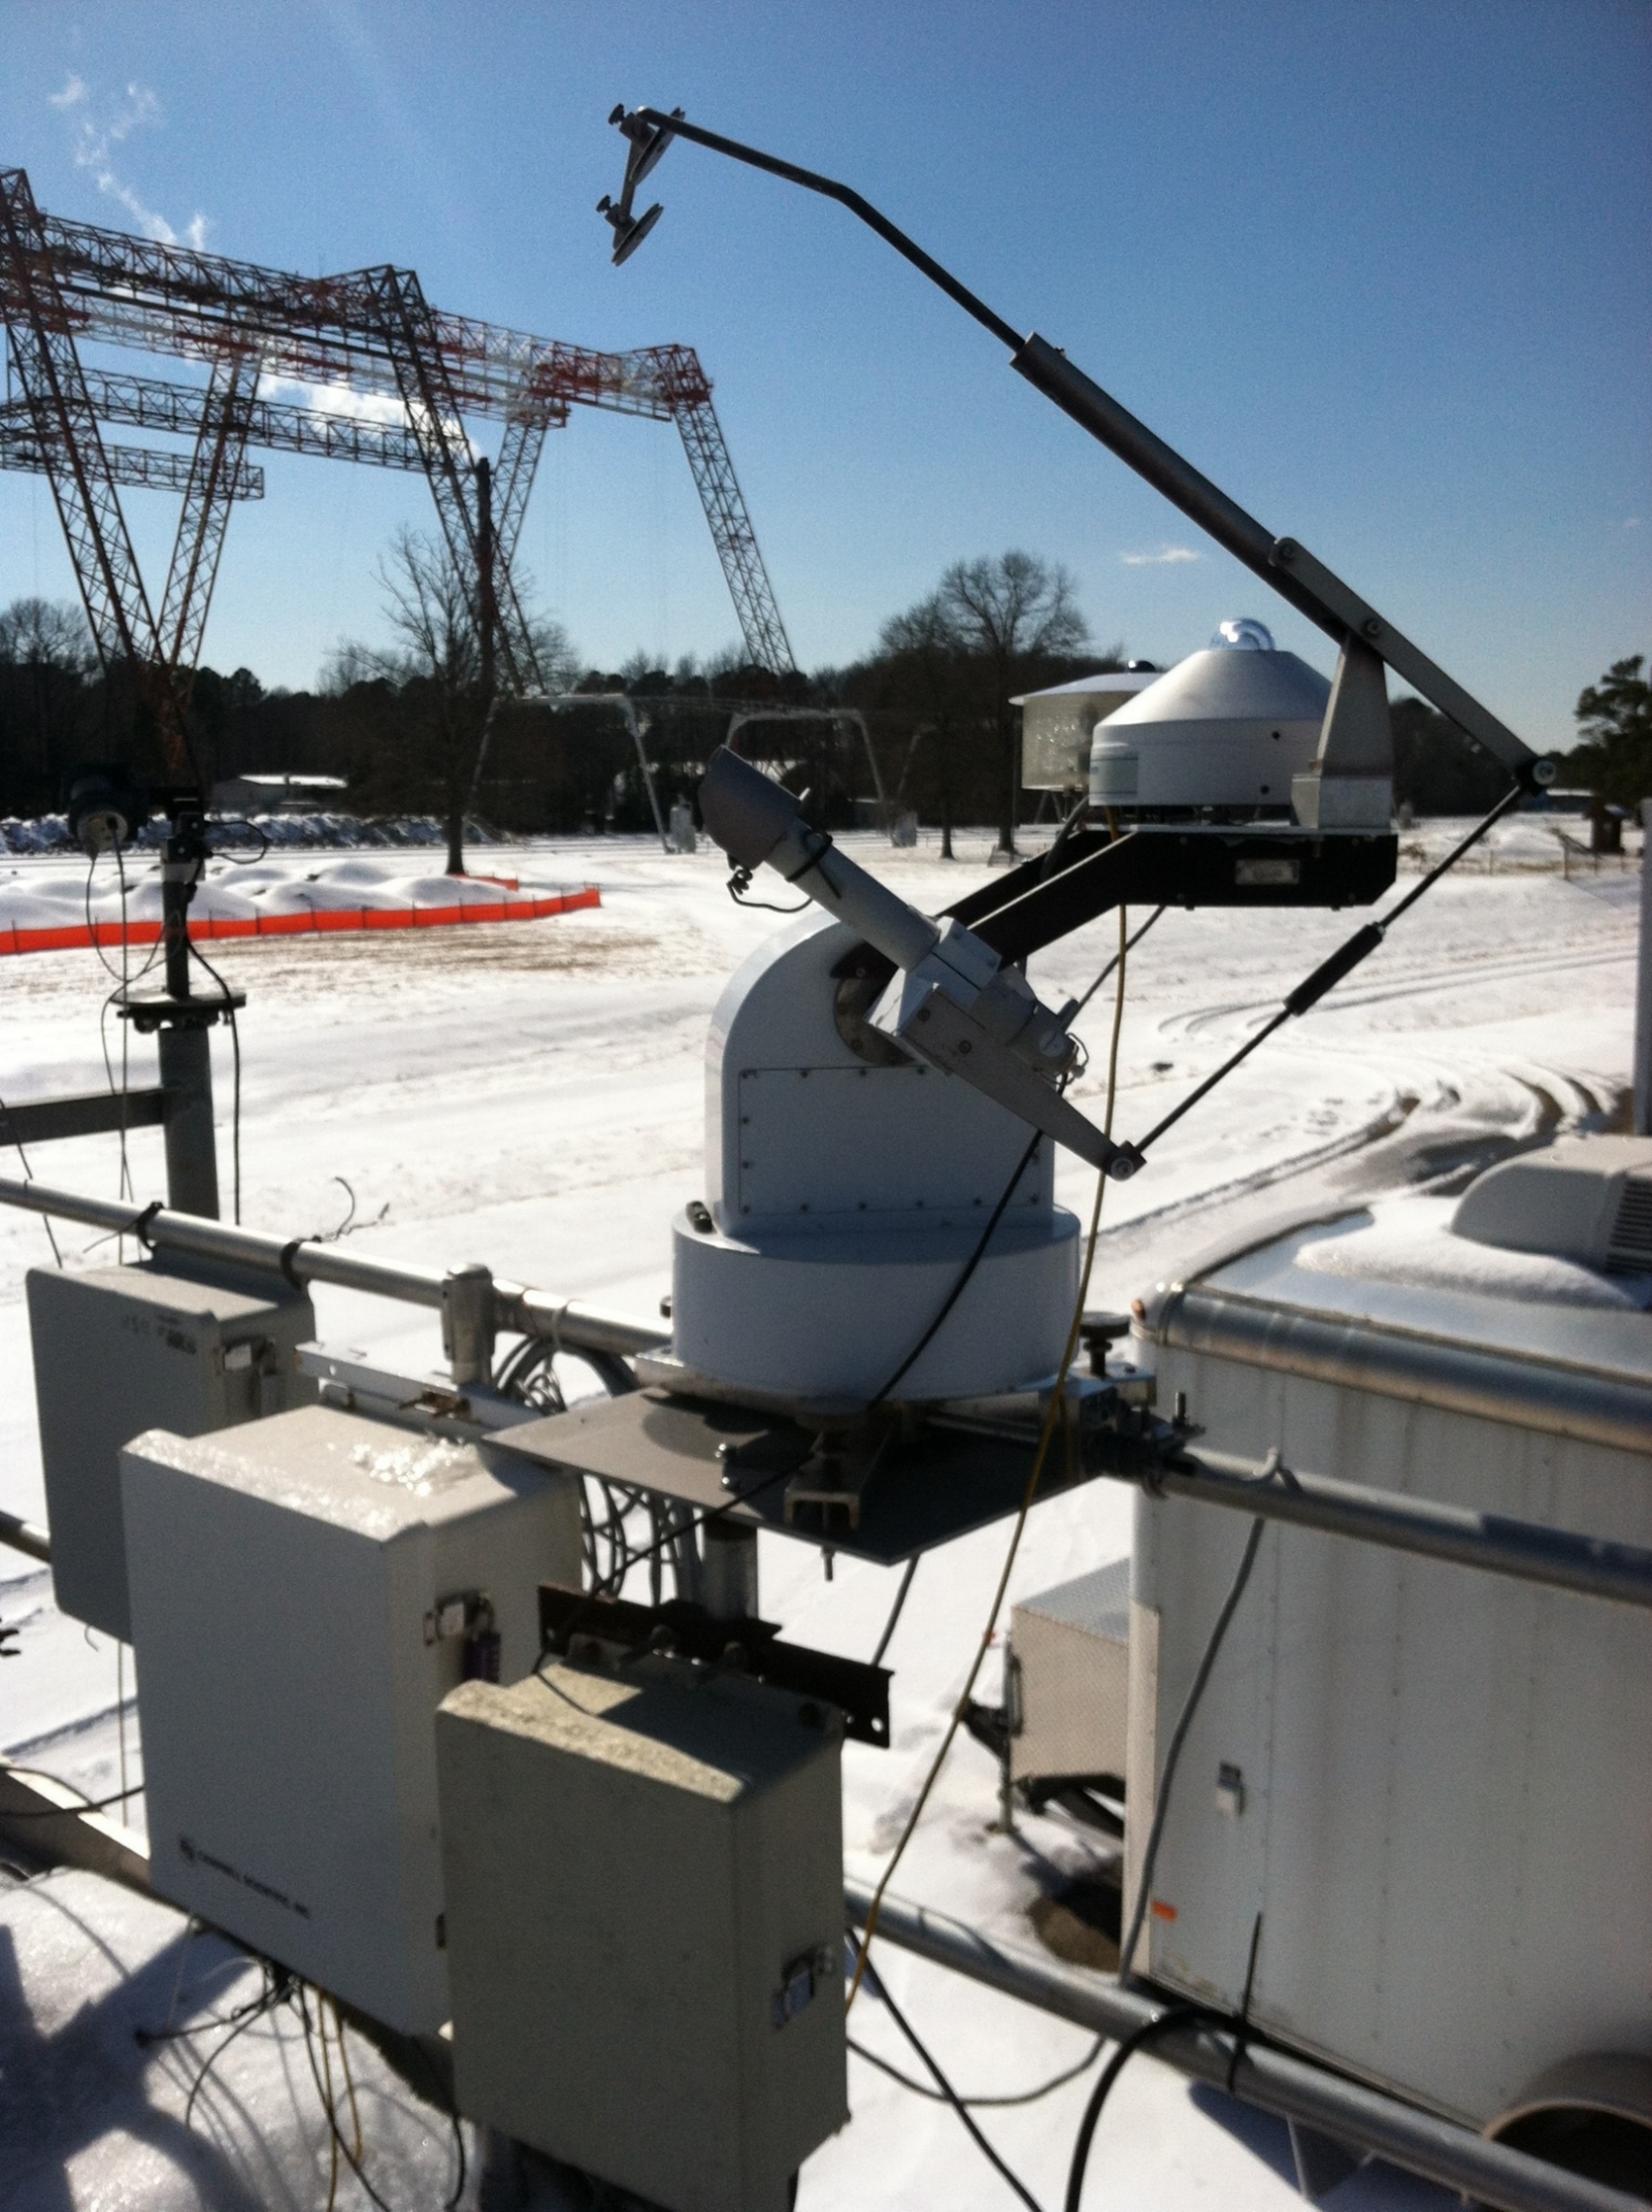
The BSRN-LRC sun tracker at the NASA Langley Research Center on a snowy day (02/20/2015) The BSRN-LRC sun tracker at the NASA Langley Research Center on a snowy day (02/20/2015)

CAPABLE-BSRN Google Site Location Image