
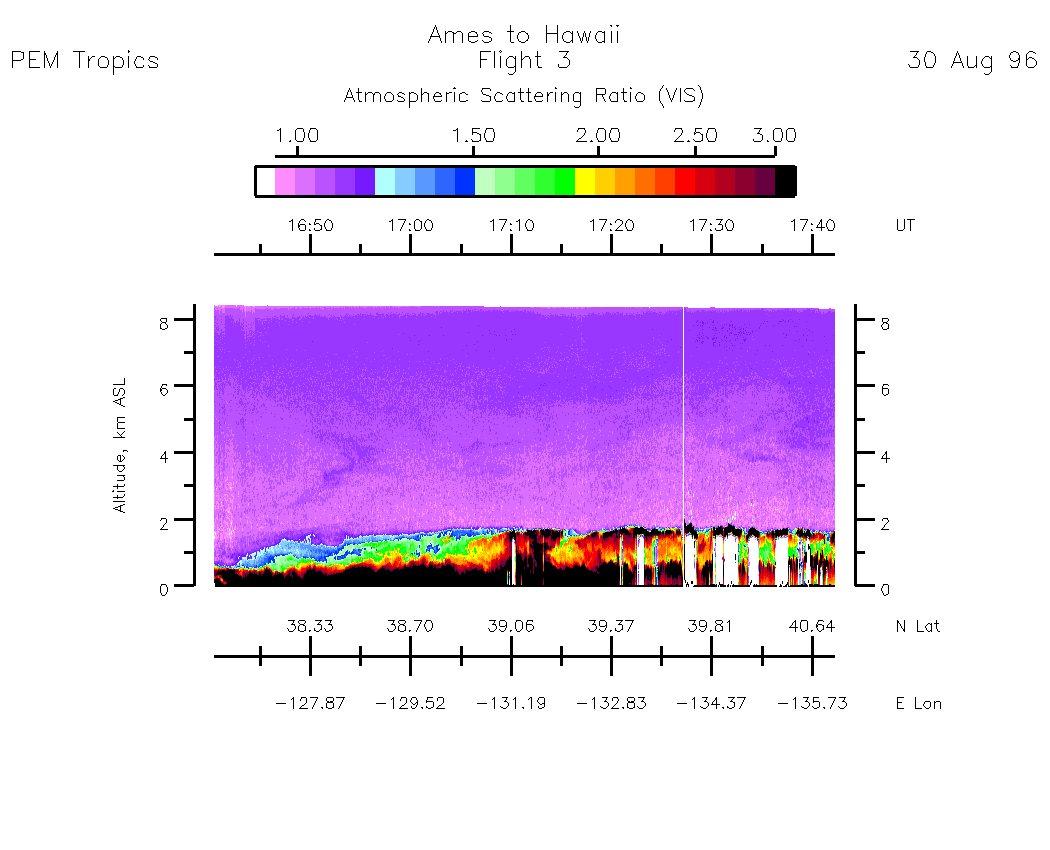
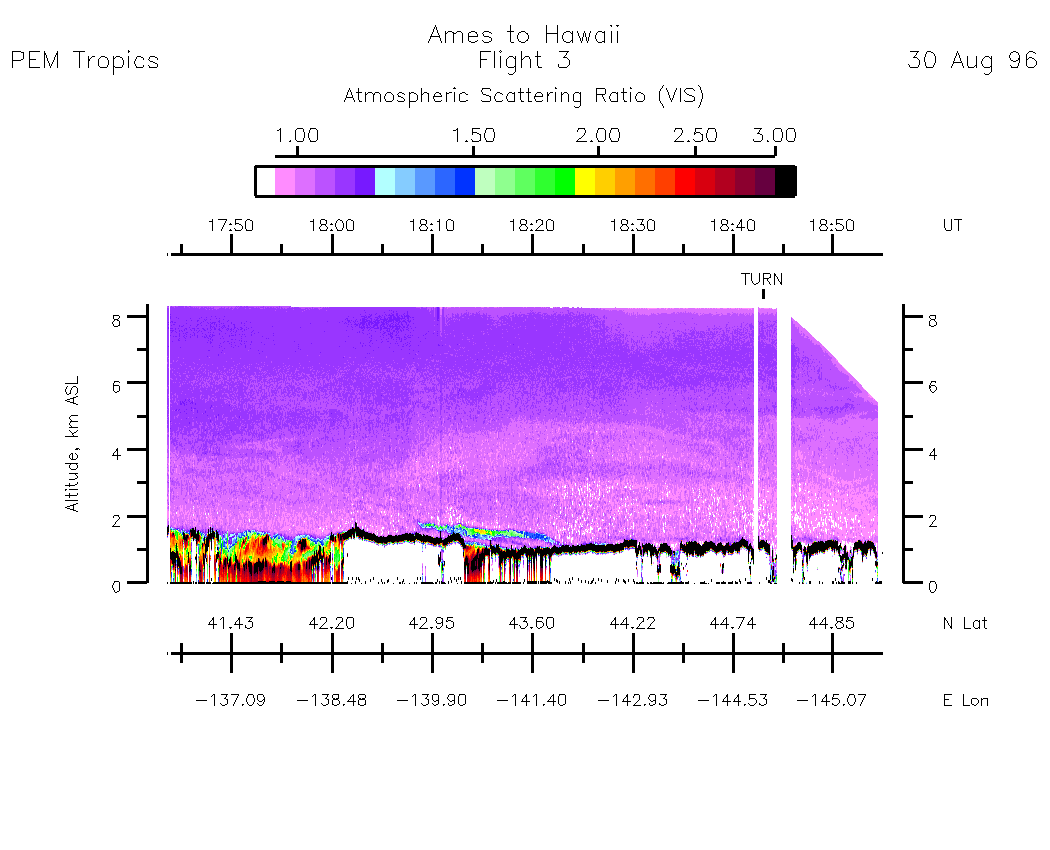
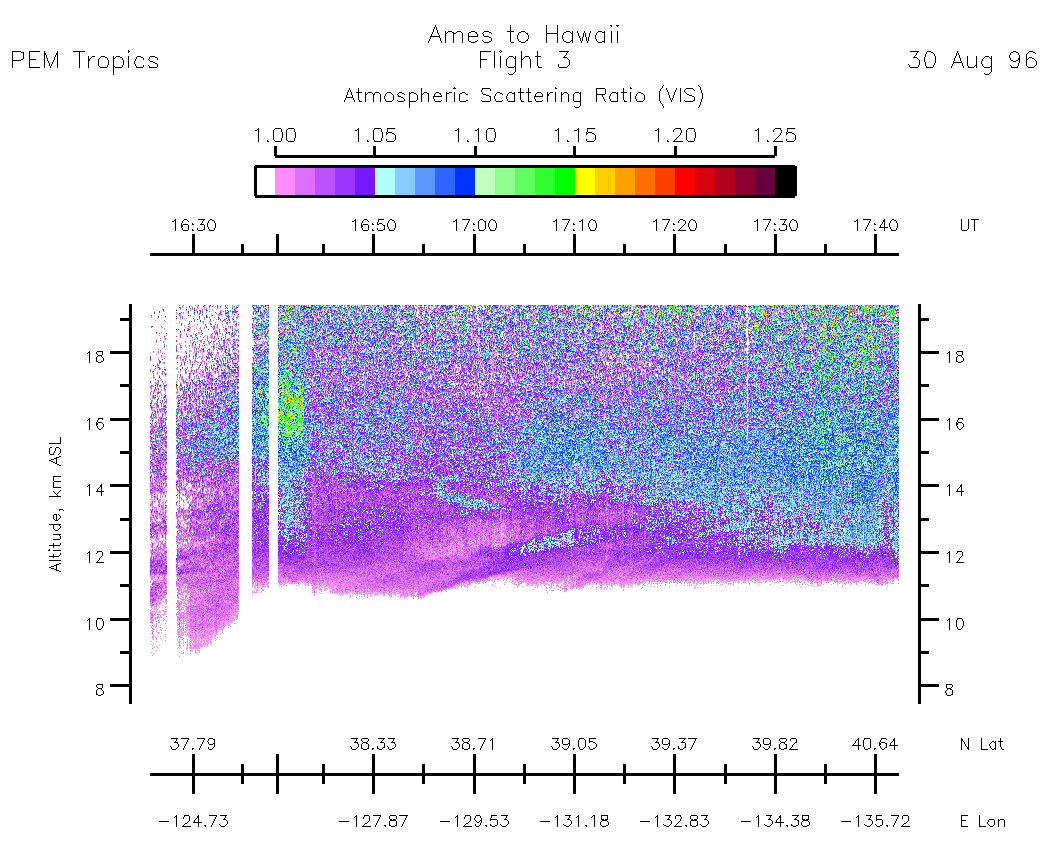
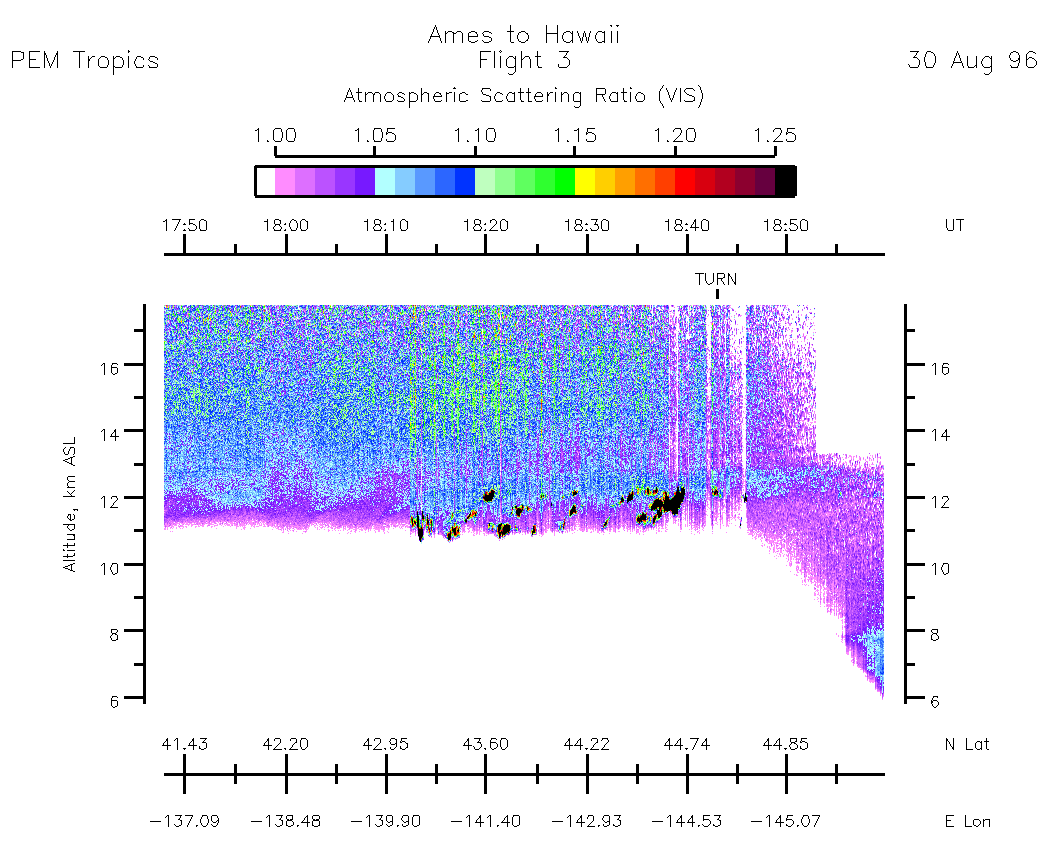
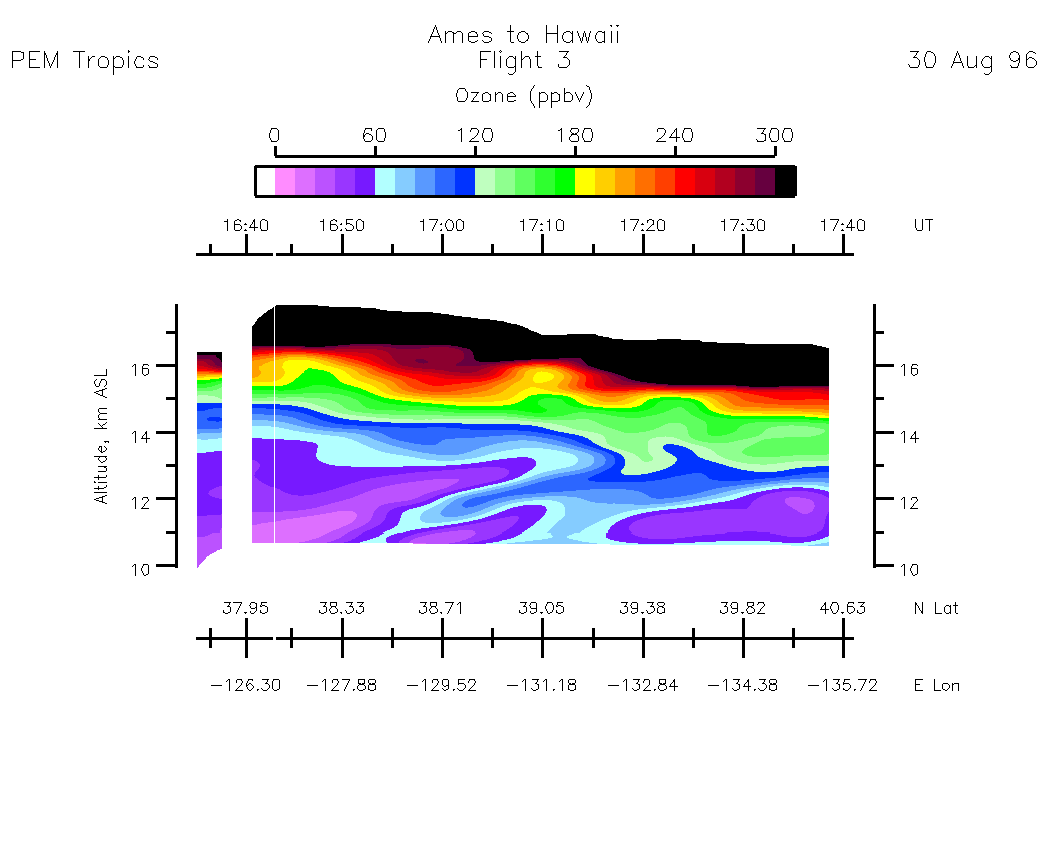
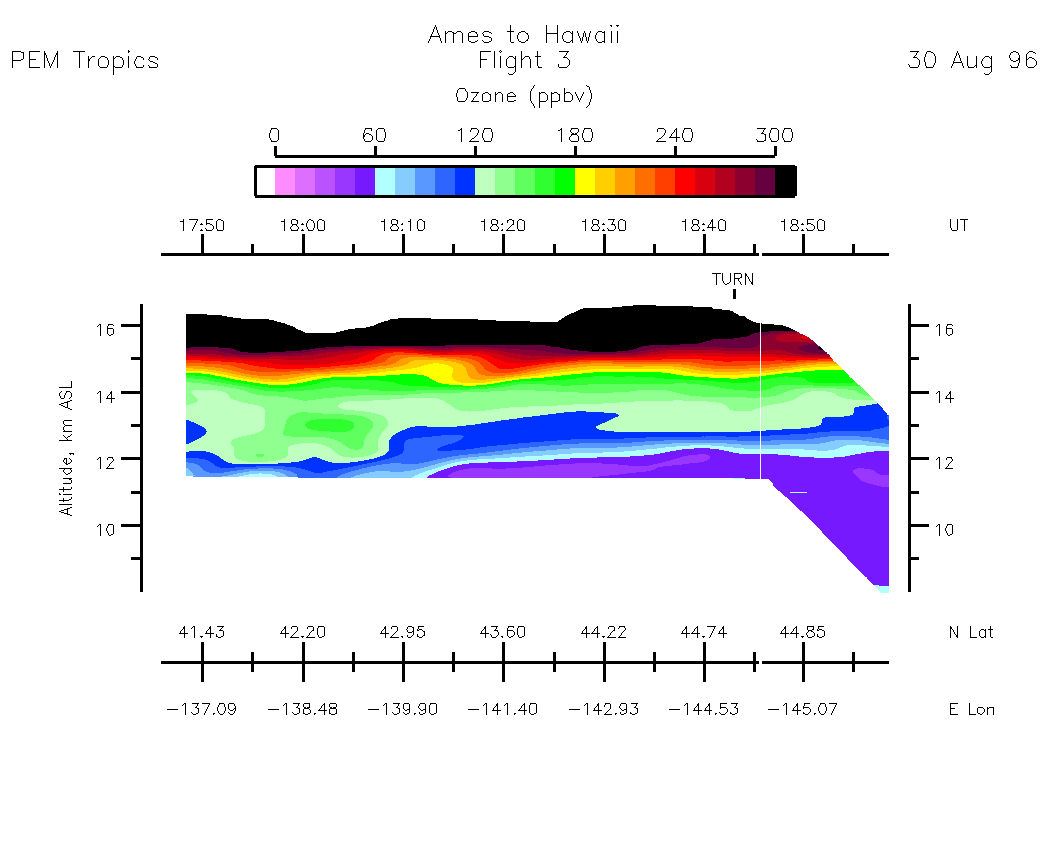
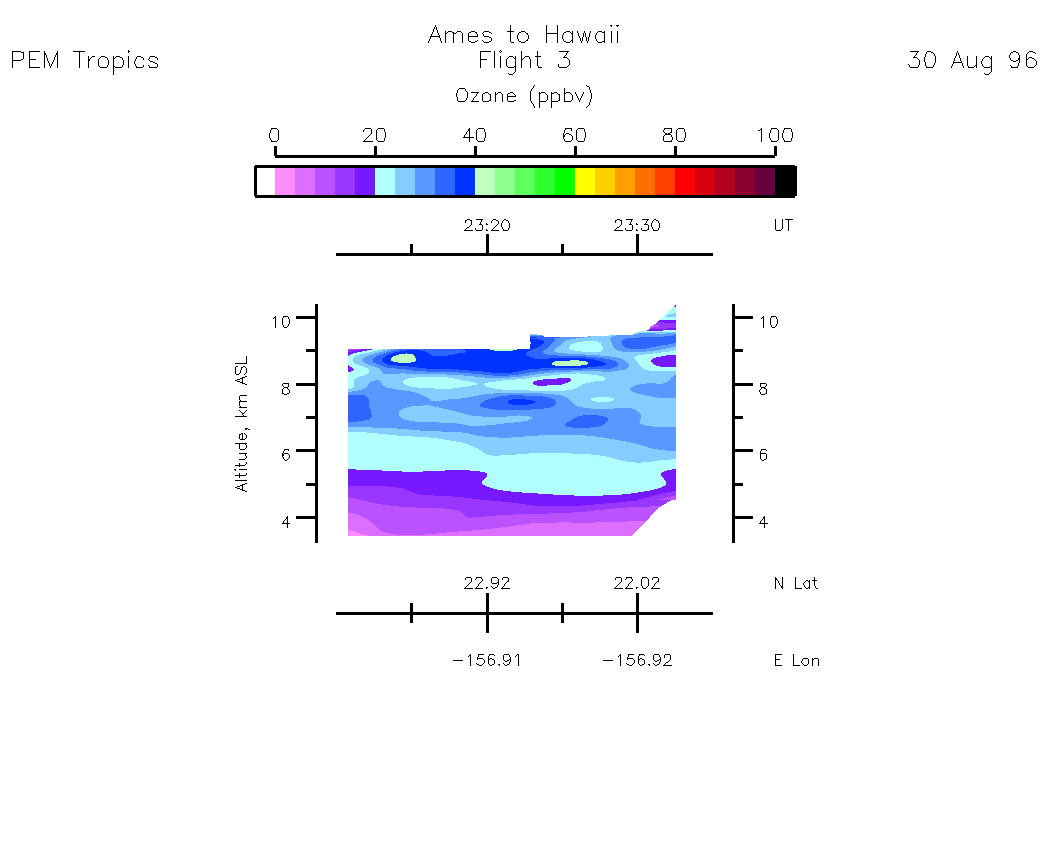
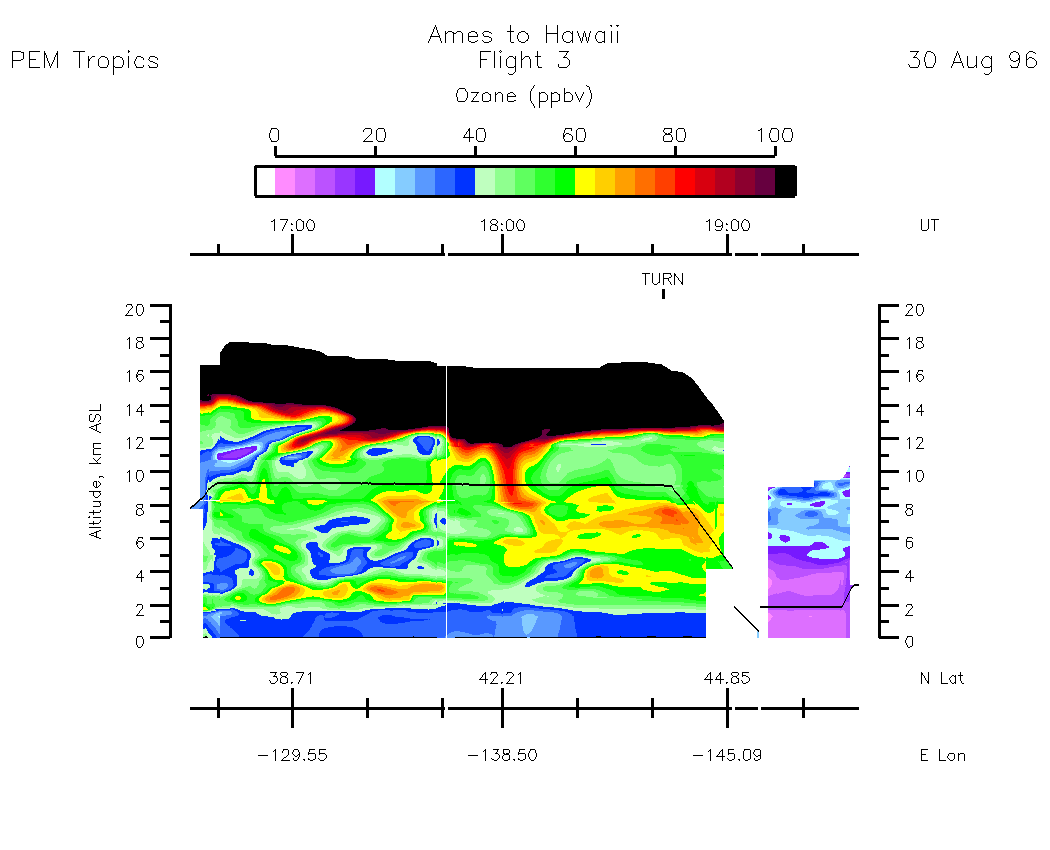
Flight 3 / Ames to Hawaii / 30 Aug 96
| 16:40:01 - 17:42:19
| 17:42:23 - 18:55:15
| movie_loop_all |
| 16:25:24 - 17:42:23
| 17:48:00 - 18:59:55
| 19:10:00 - 22:36:00
| 22:54:00 - 23:37:00
| movie_loop_all |
| 16:34:31 - 17:40:55
| 17:45:15 - 18:54:35
| movie_loop_all |
| 16:33:34 - 17:42:23
| 17:42:29 - 18:58:32
| 23:10:00 - 23:35:04
| movie_loop_all |
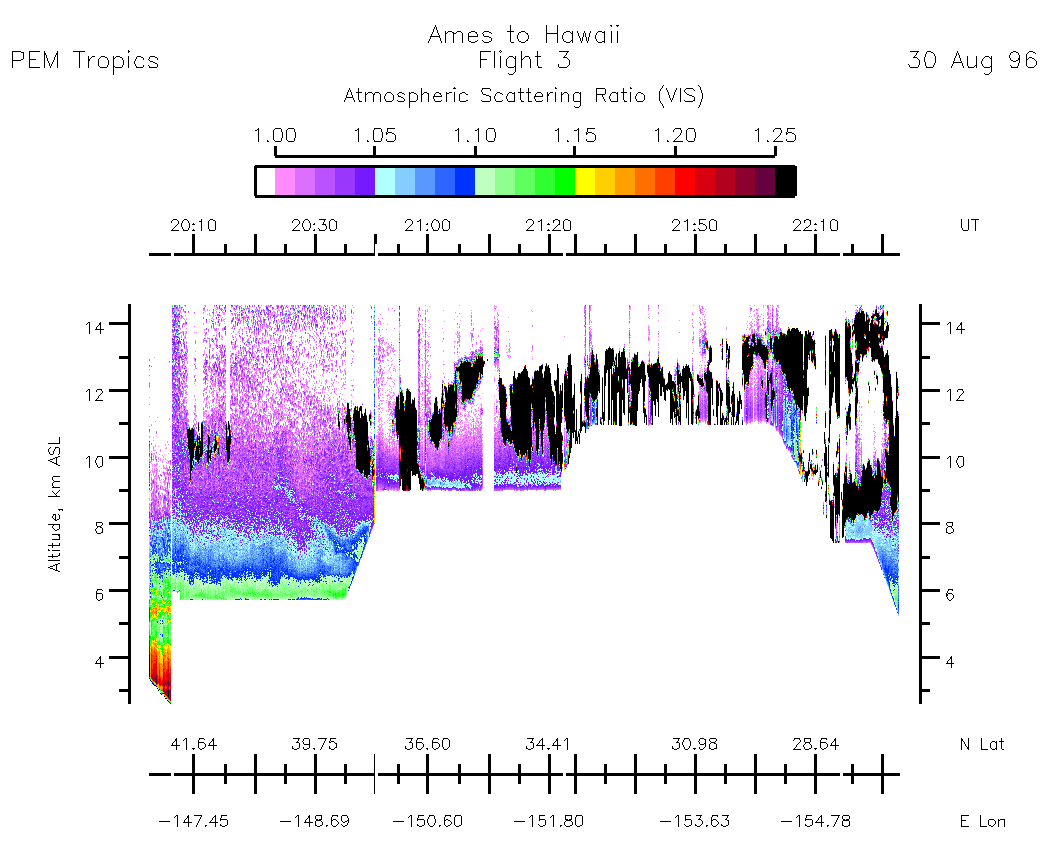
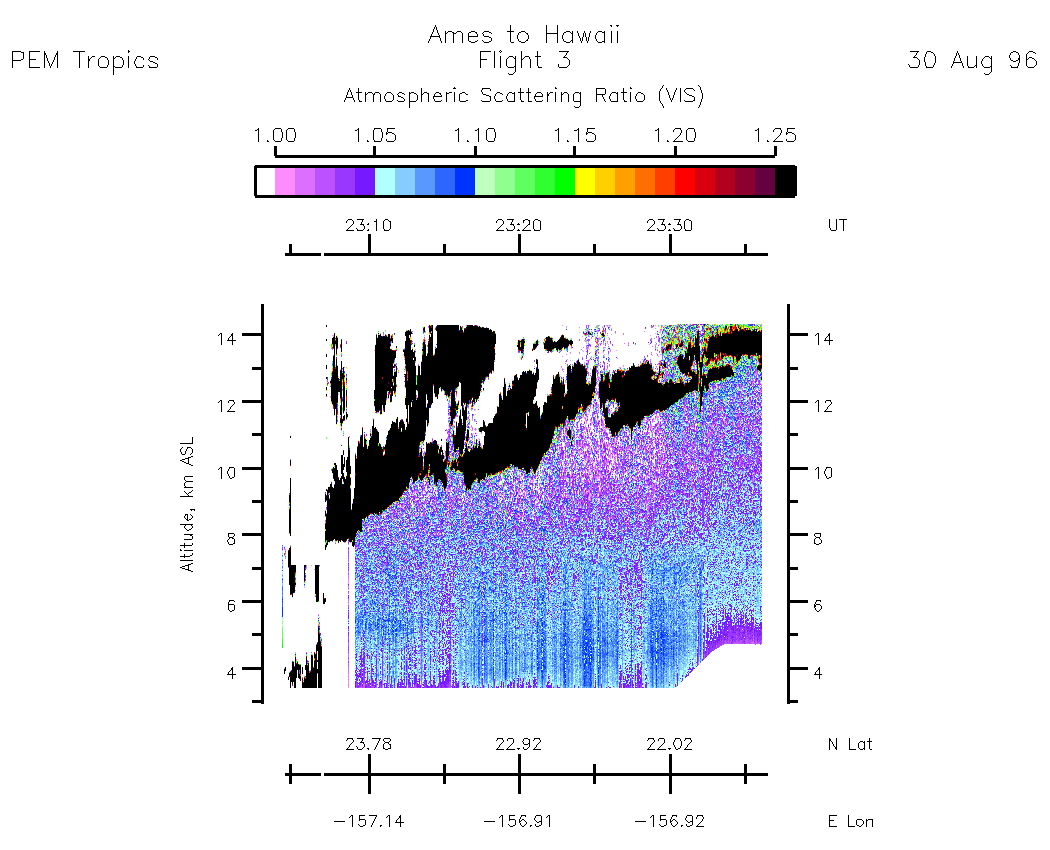
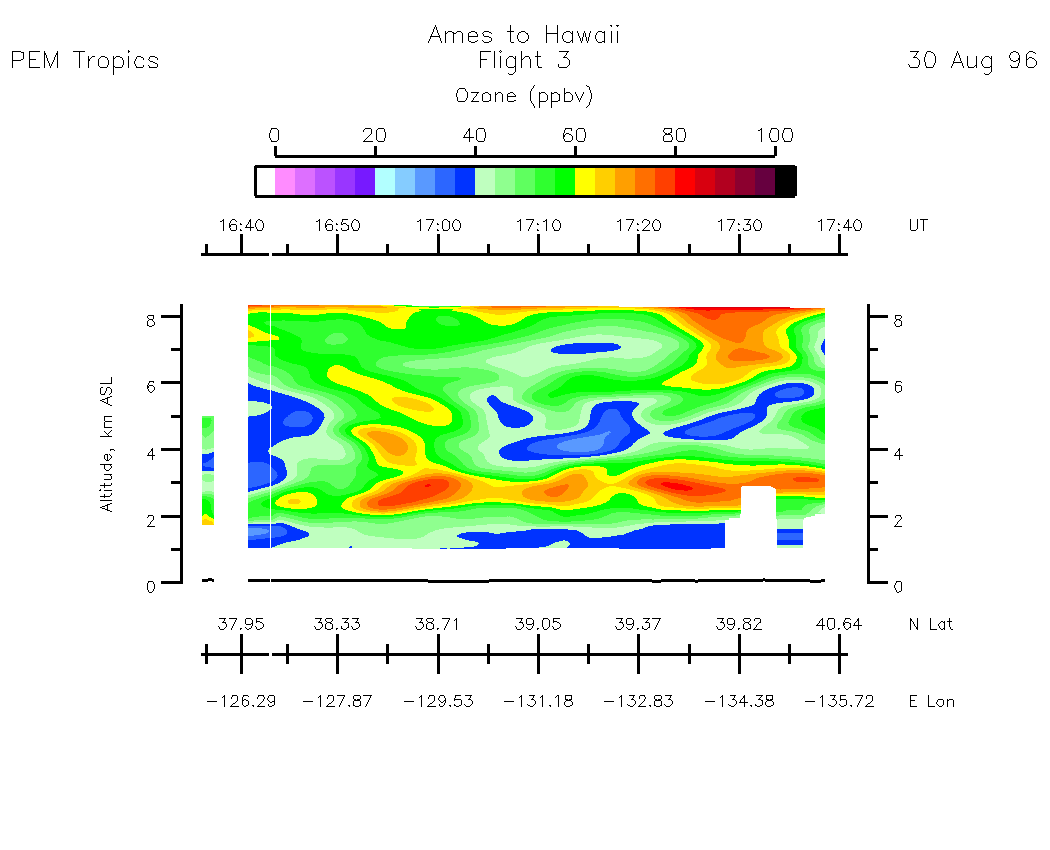
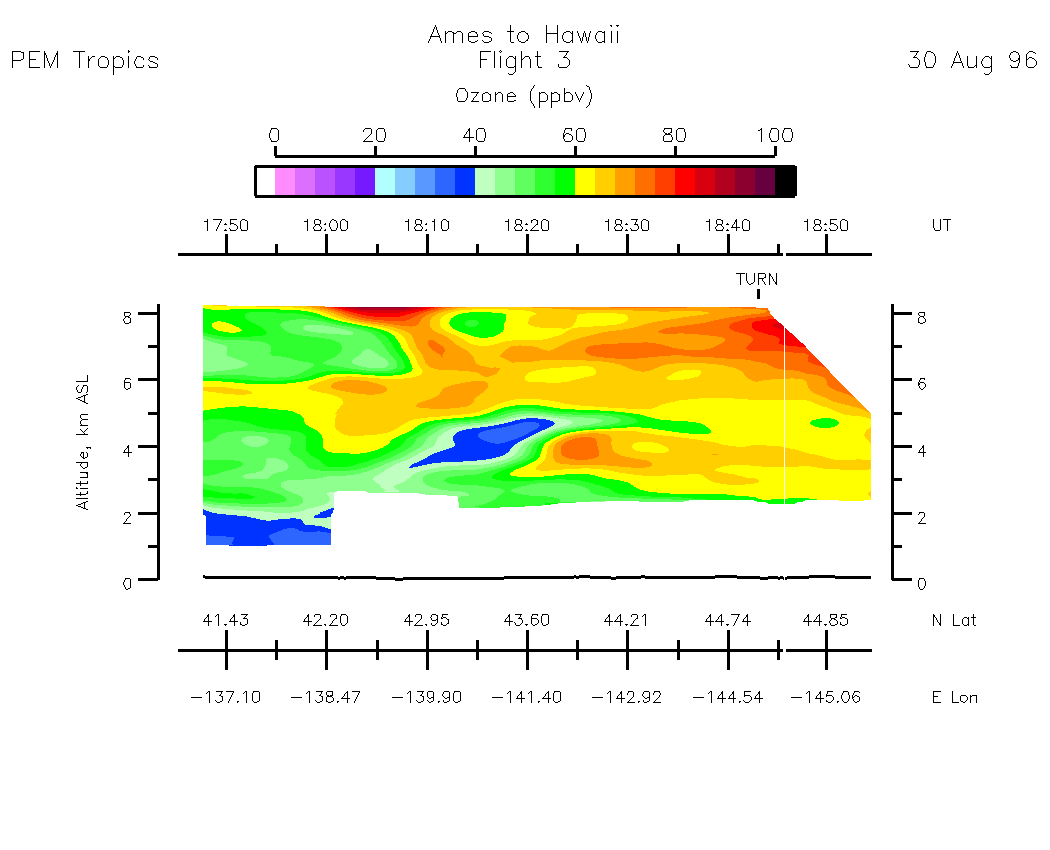
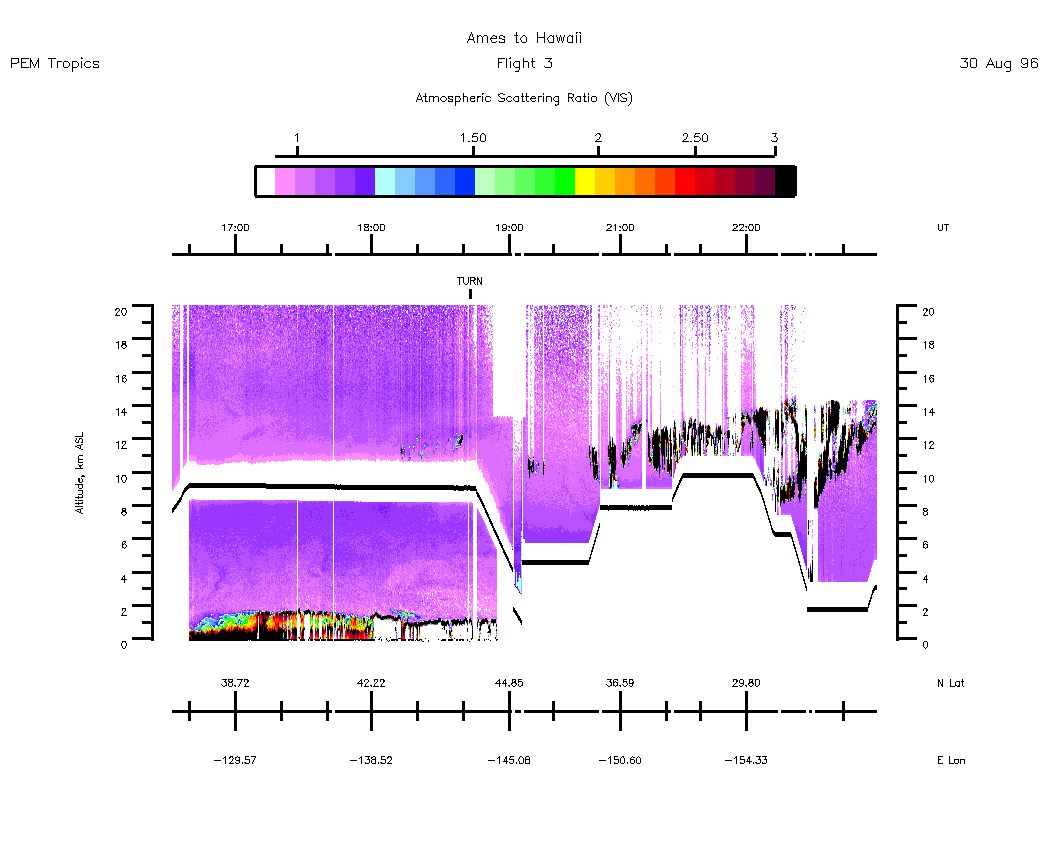
The below airborne UV DIAL Lidar color images illustrate the Nadir and Zenith derived relative backscatter and ozone for this flight at their respective times.
Nadir Aerosol - (Atmospheric Scattering Ratio)
Zenith Aerosol - (Atmospheric Scattering Ratio)
Nadir Ozone Mixing Ratio
Zenith Ozone Mixing Ratio
Composite Tropospheric Ozone Cross-Sections --- (Note: Blackline depicts aircraft altitude)
Composite Aerosol Cross-Sections --- (Note: Blackline depicts aircraft altitude)