|
|
|
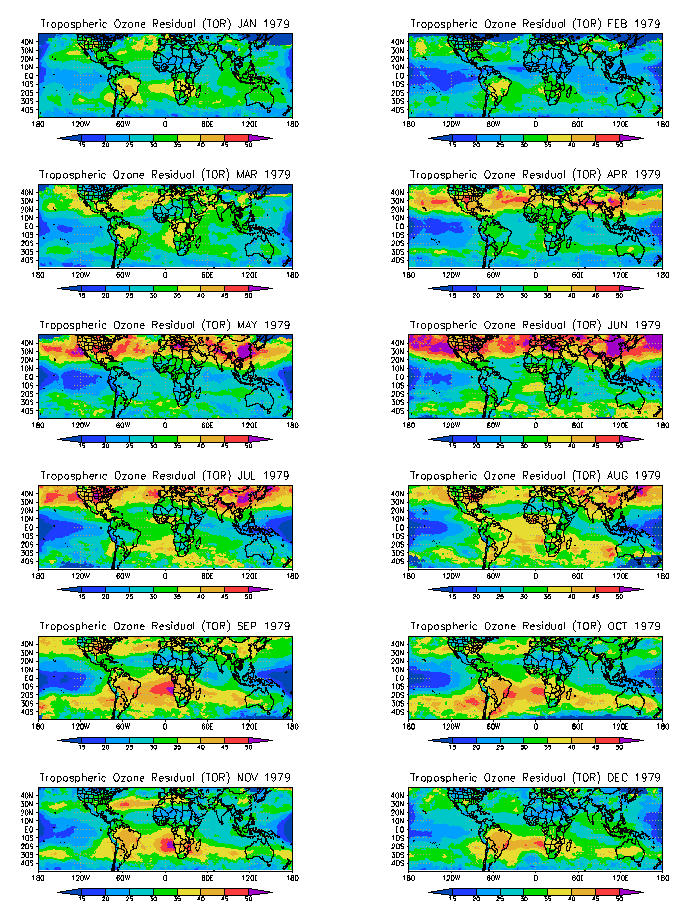
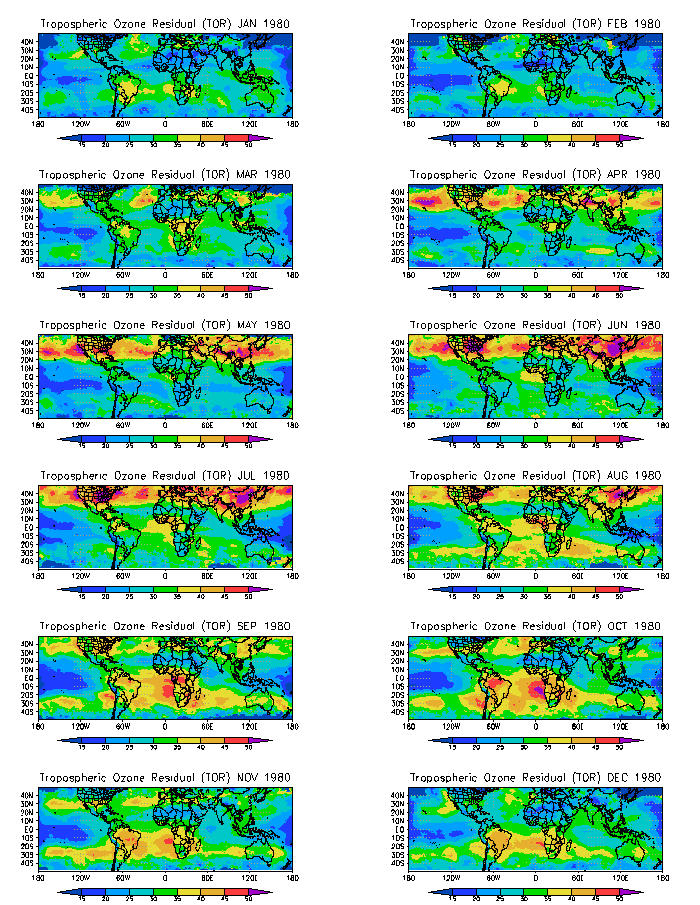
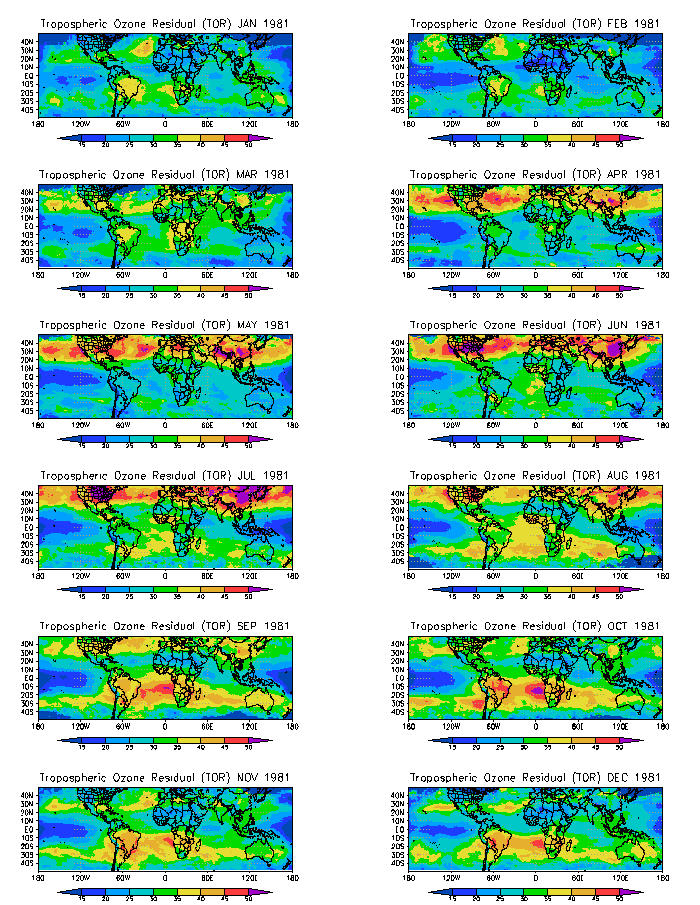
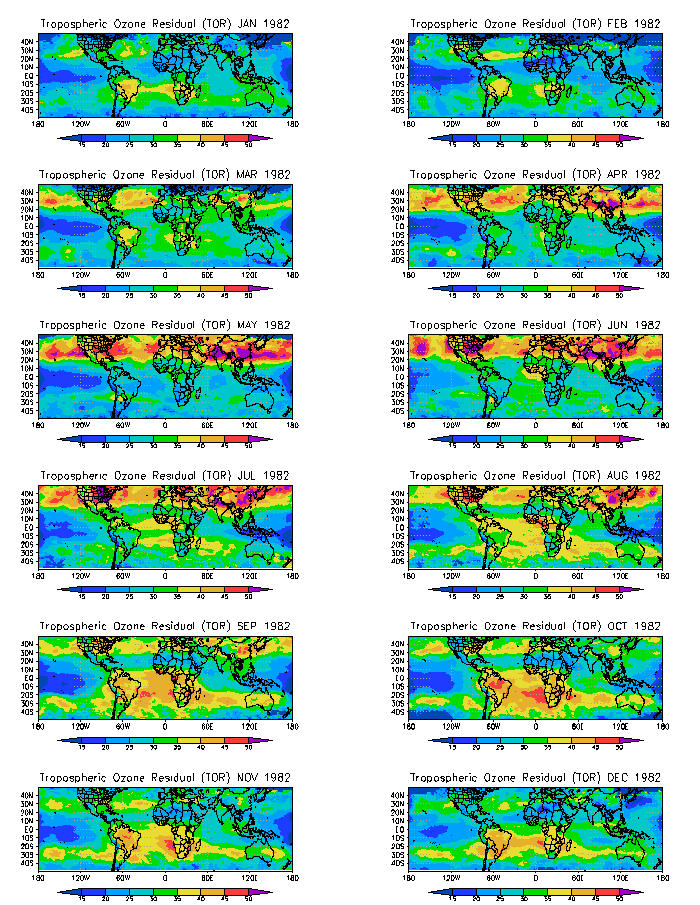
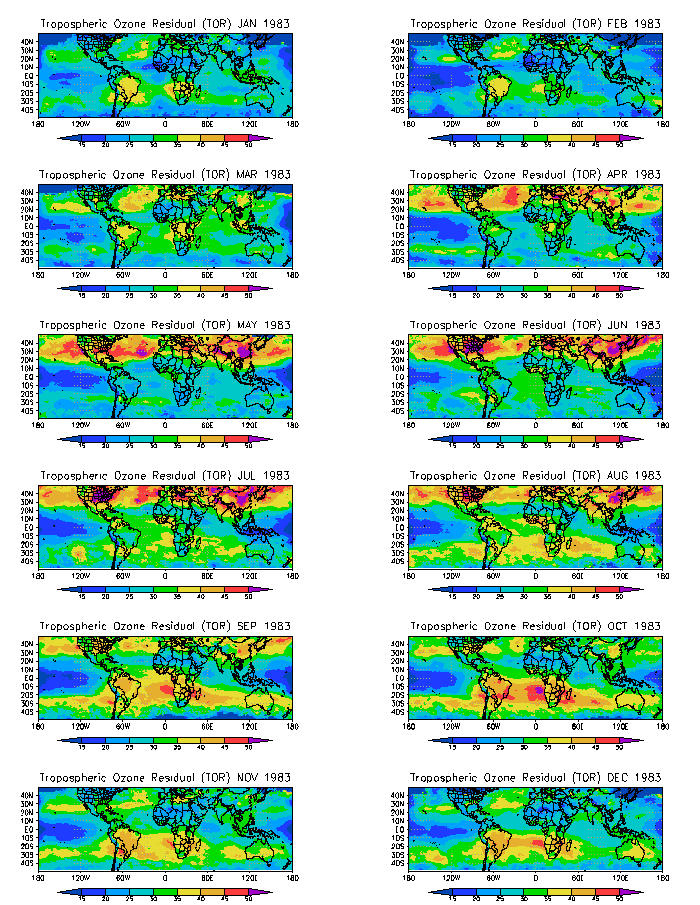
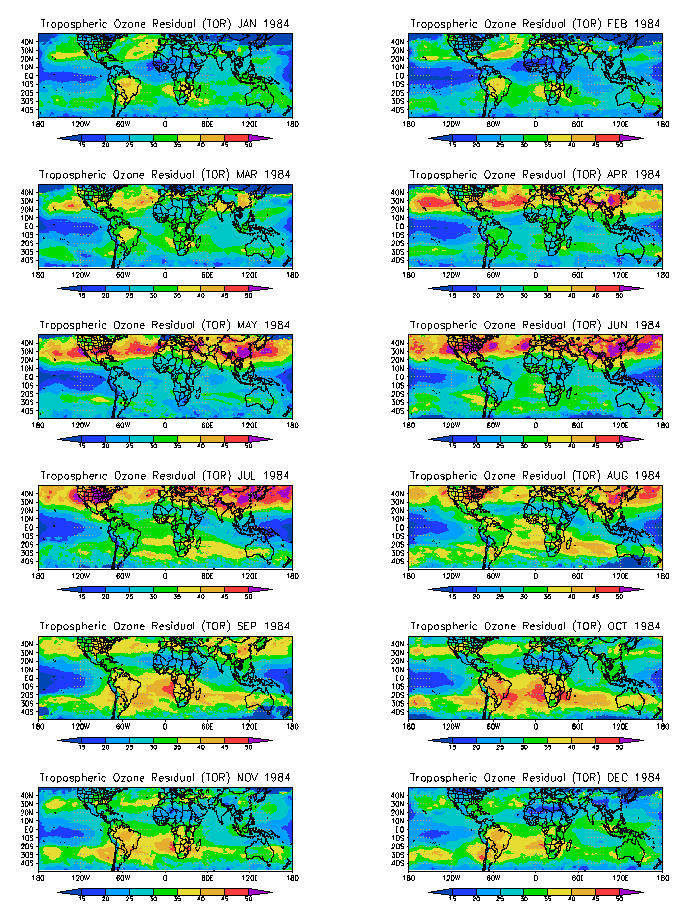
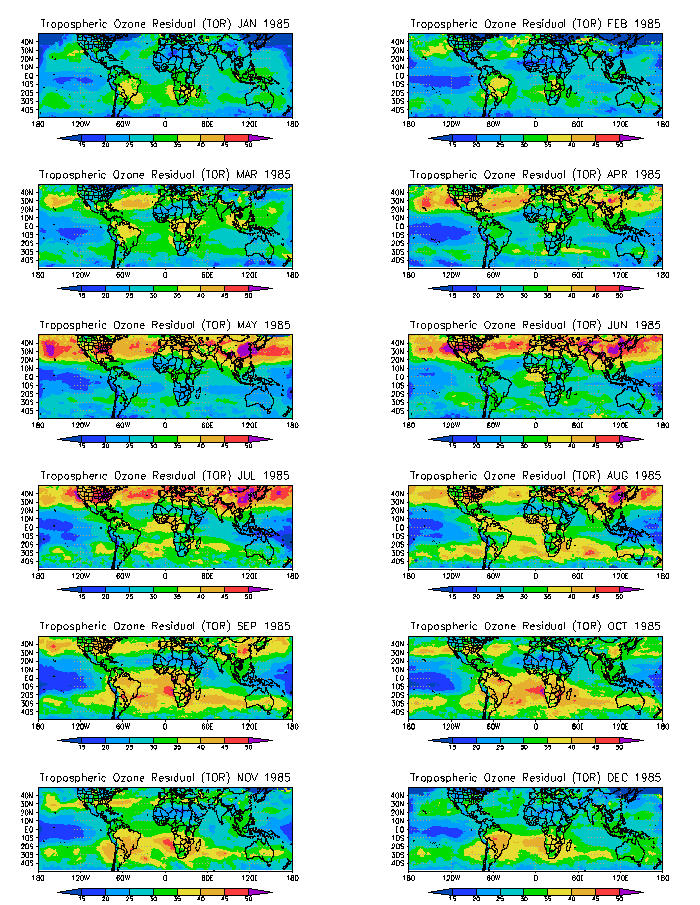
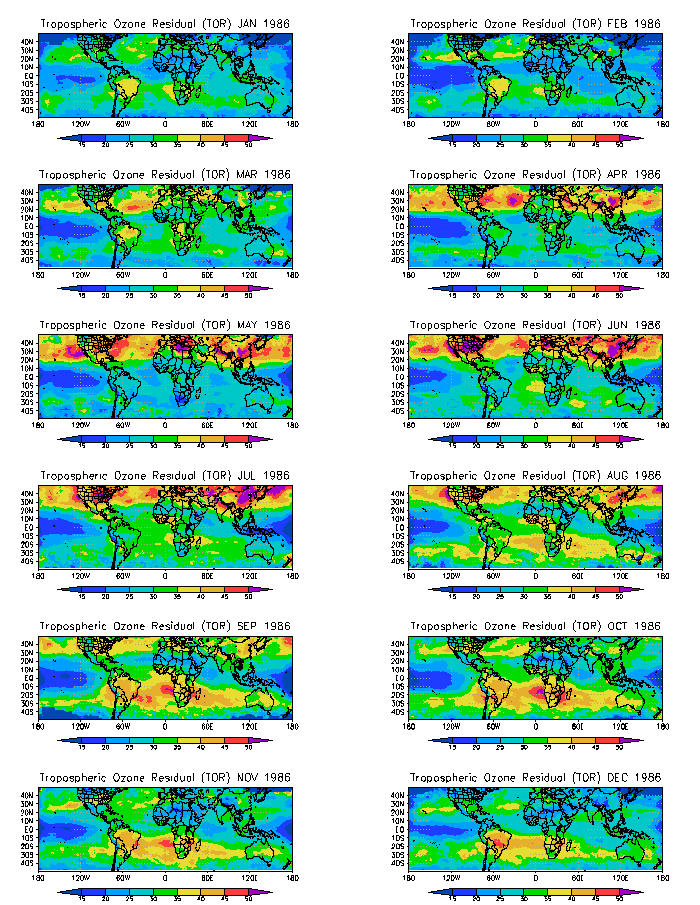
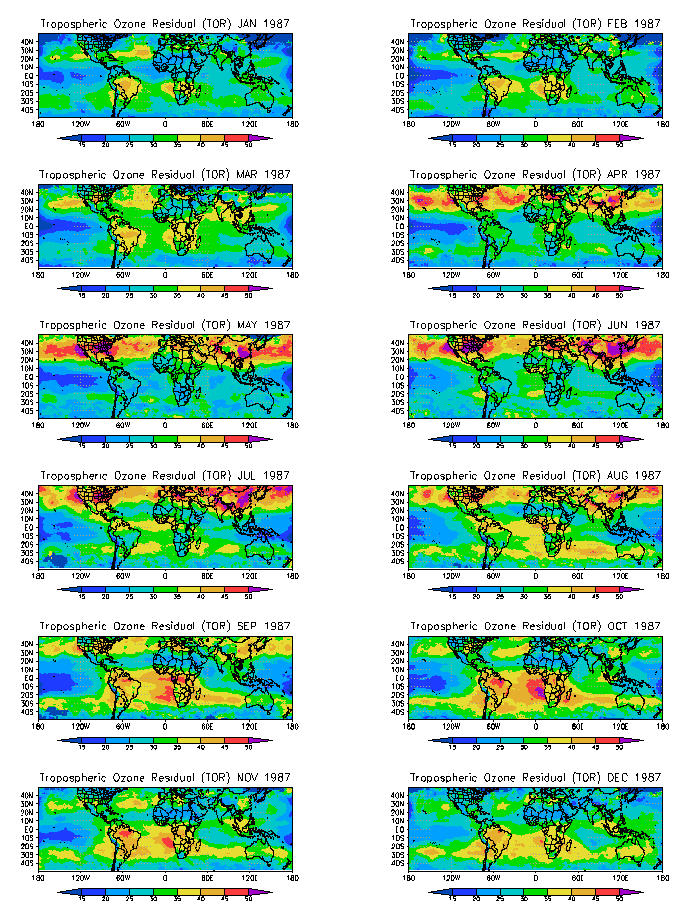
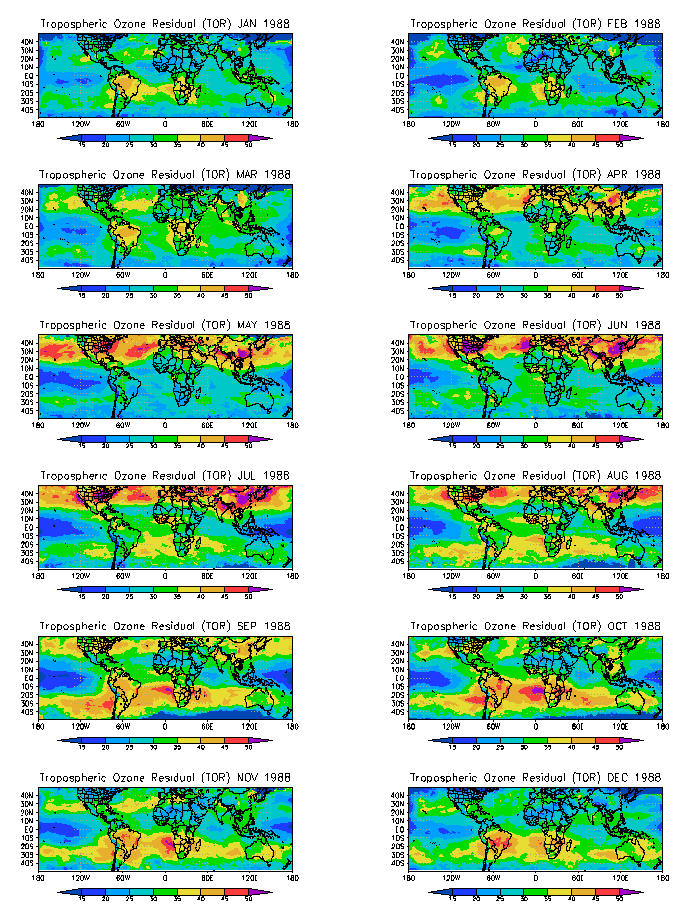
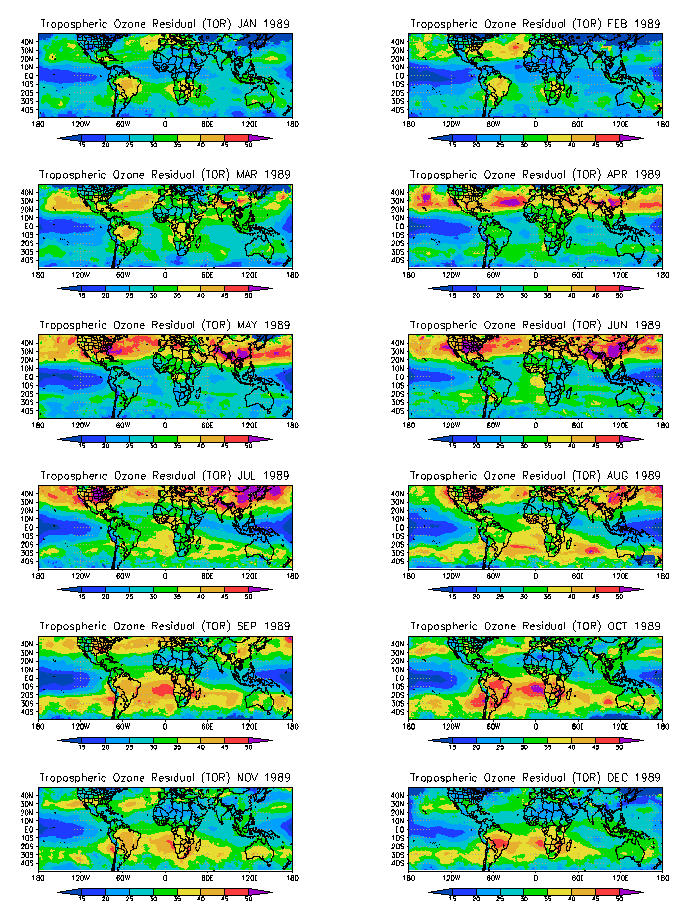
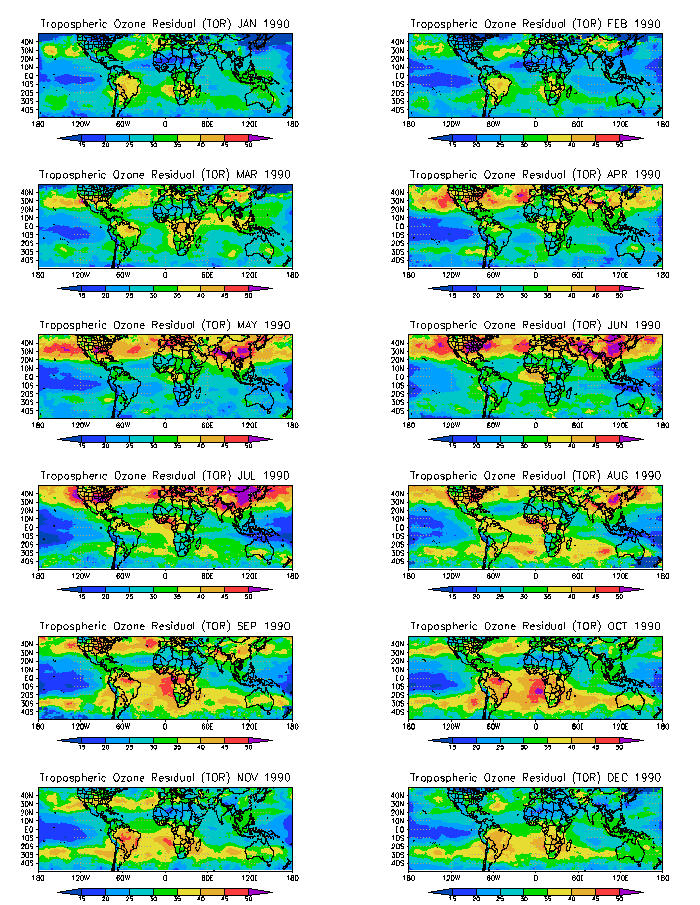
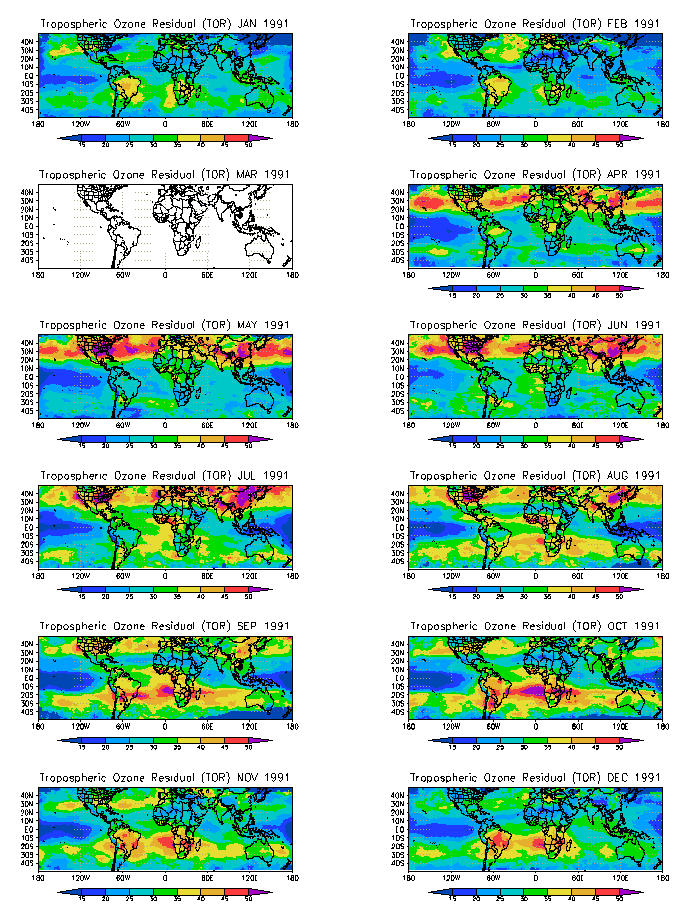
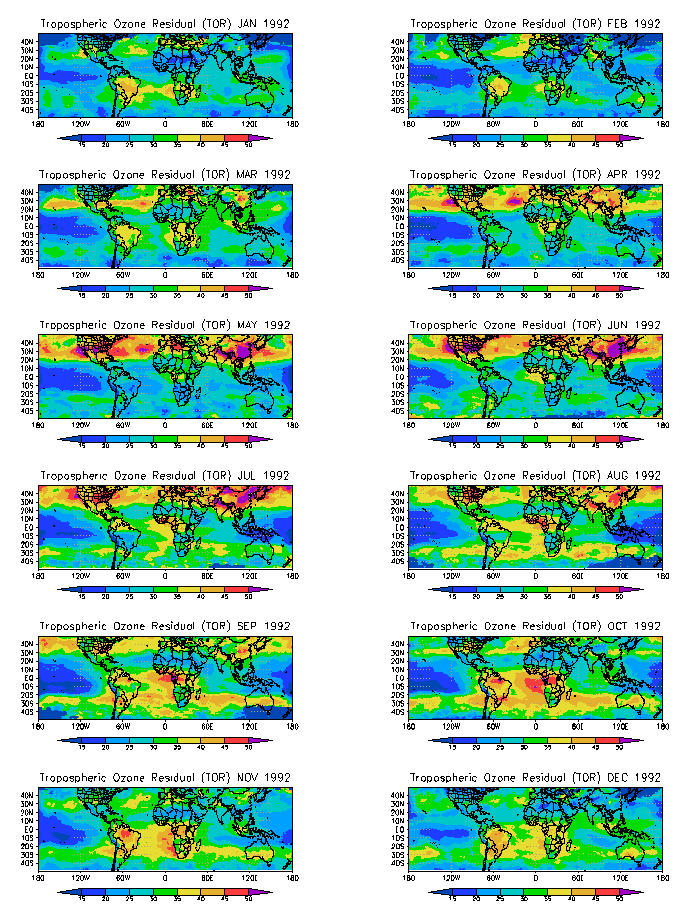
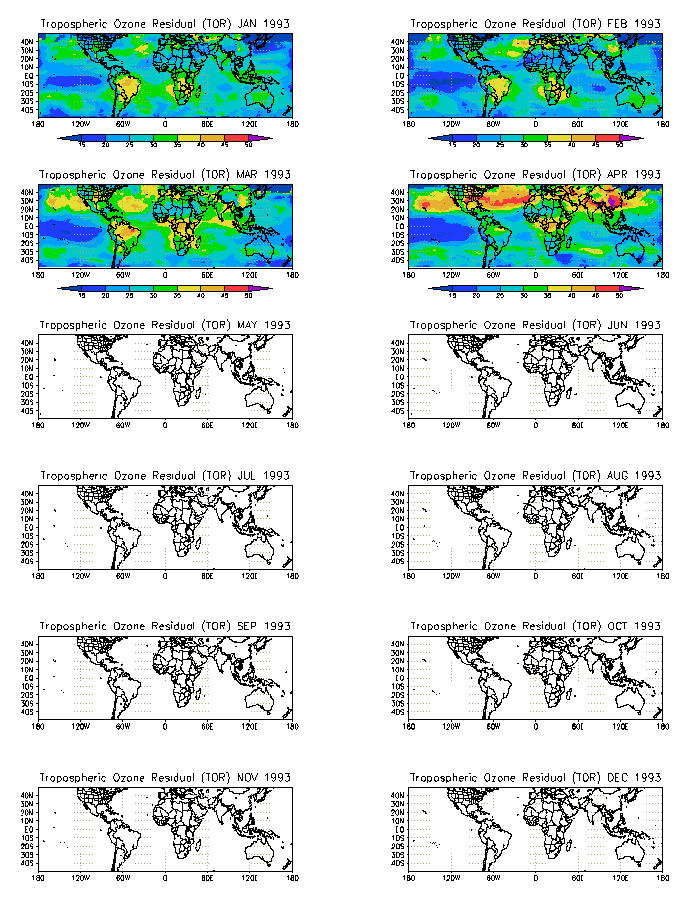
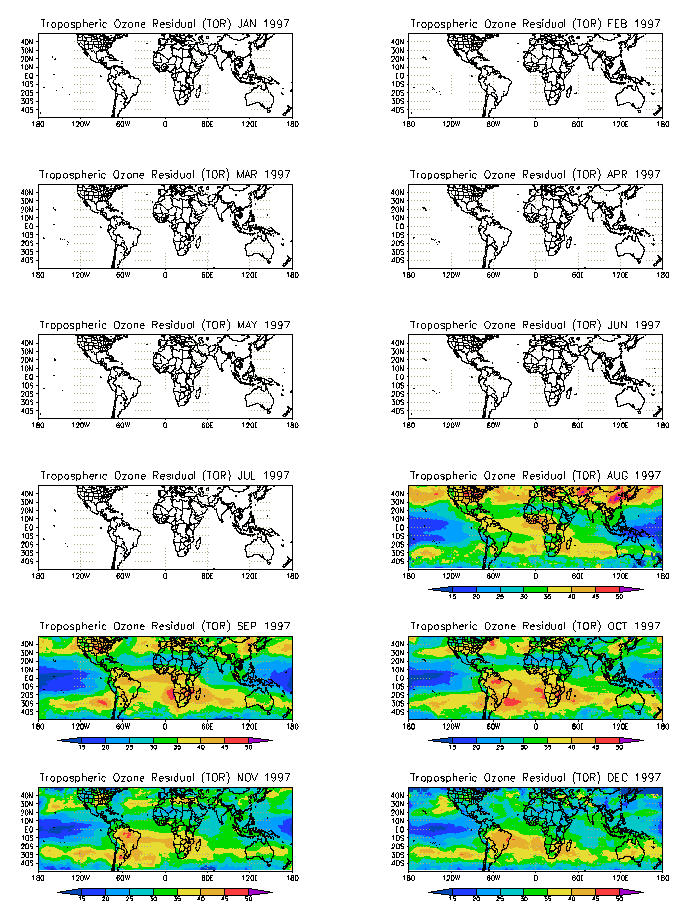
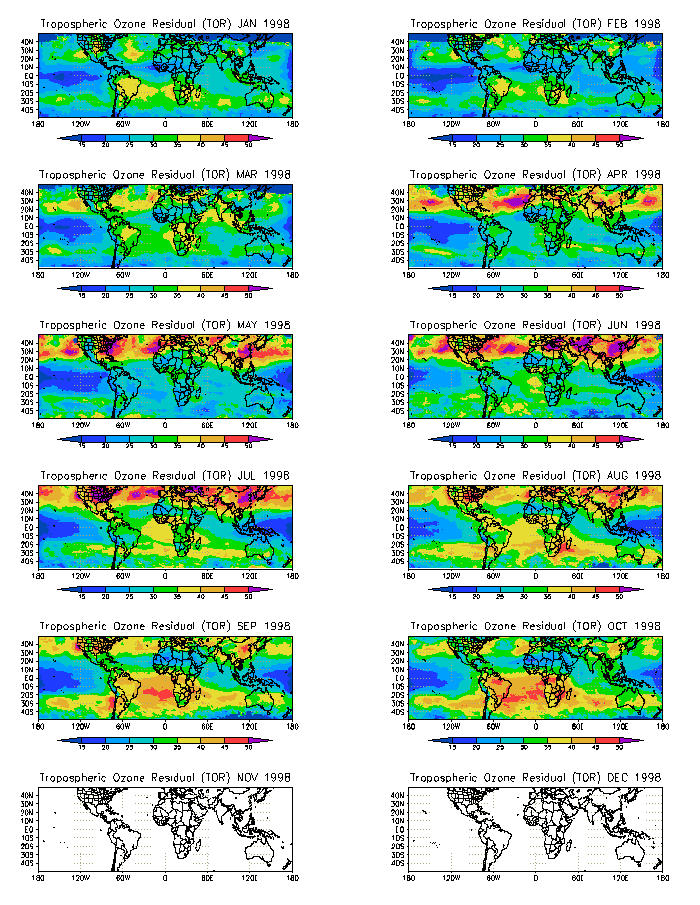
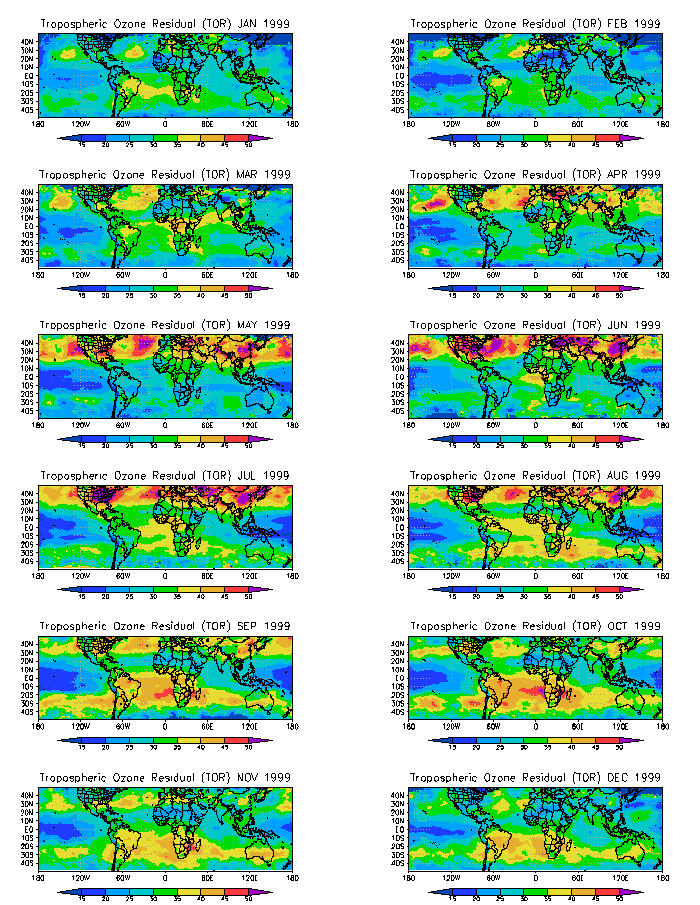
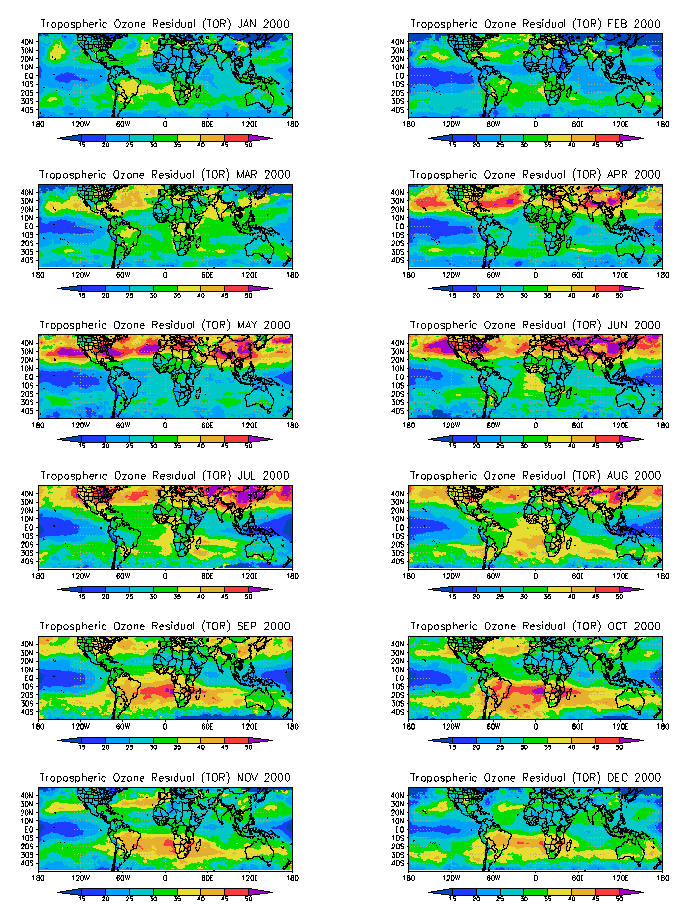
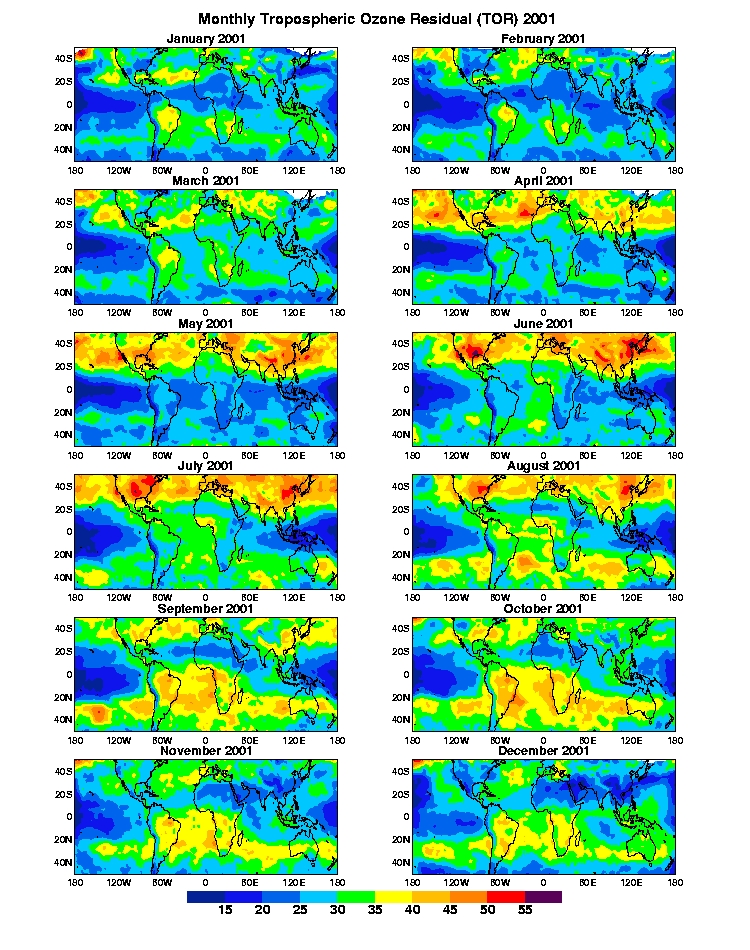
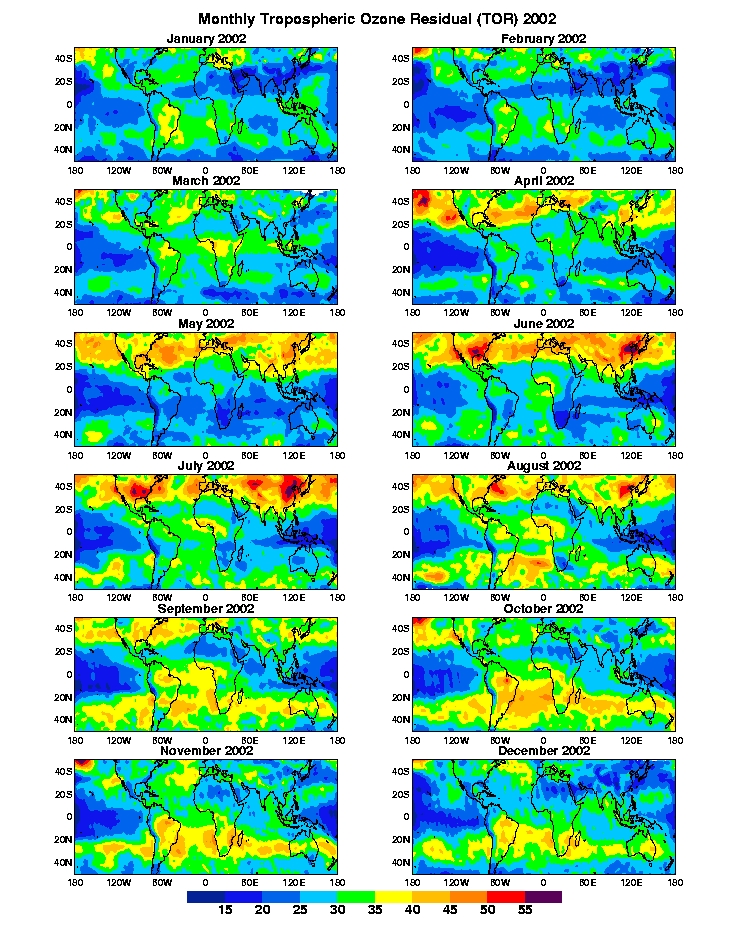
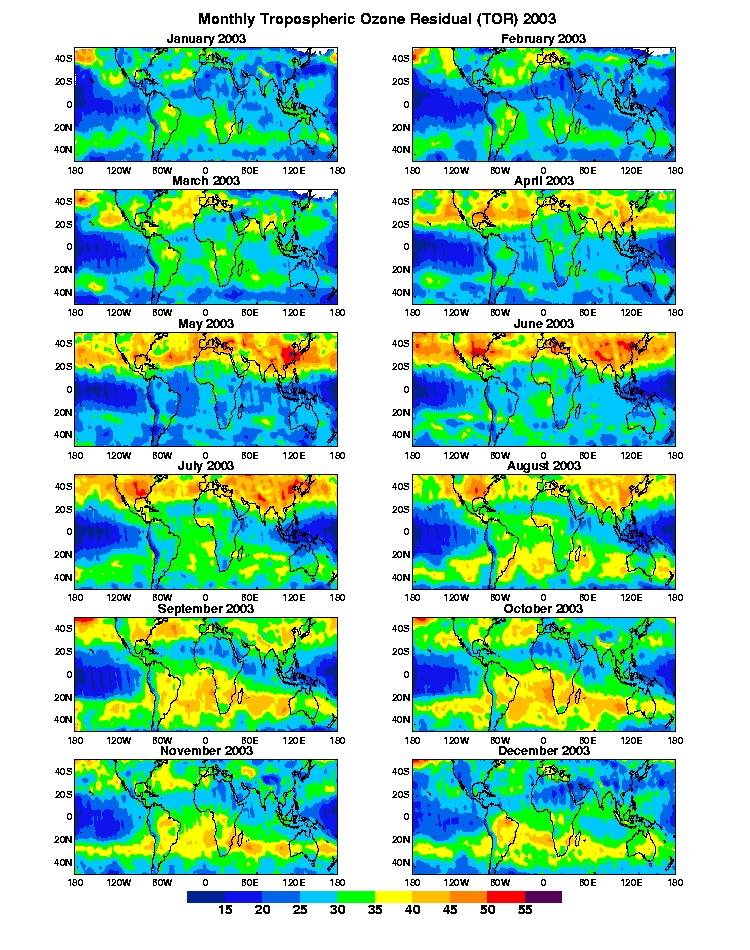
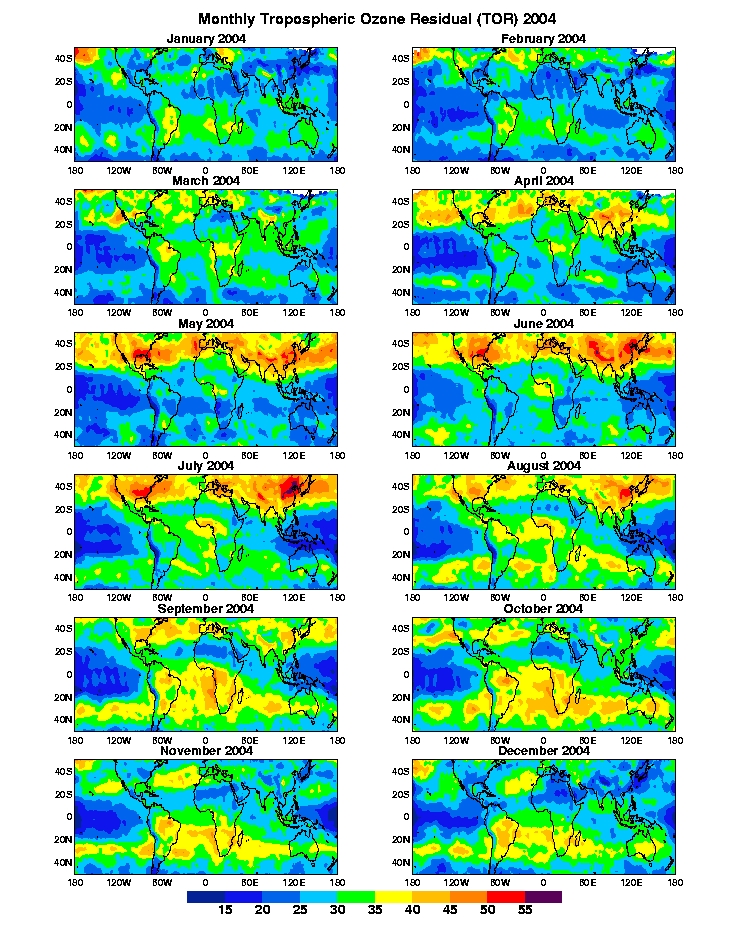
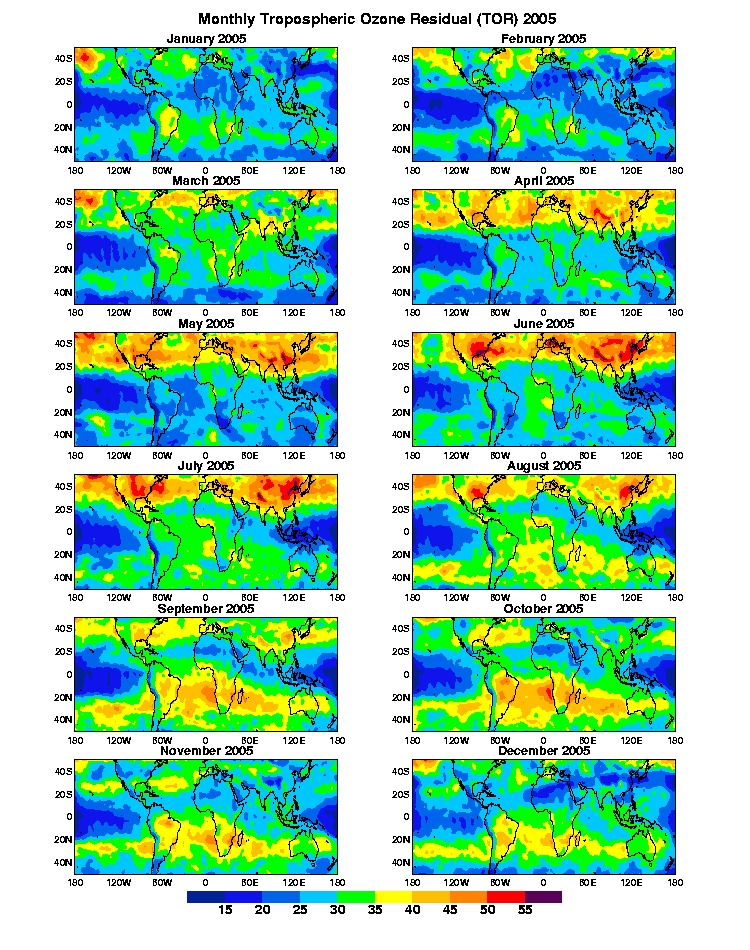
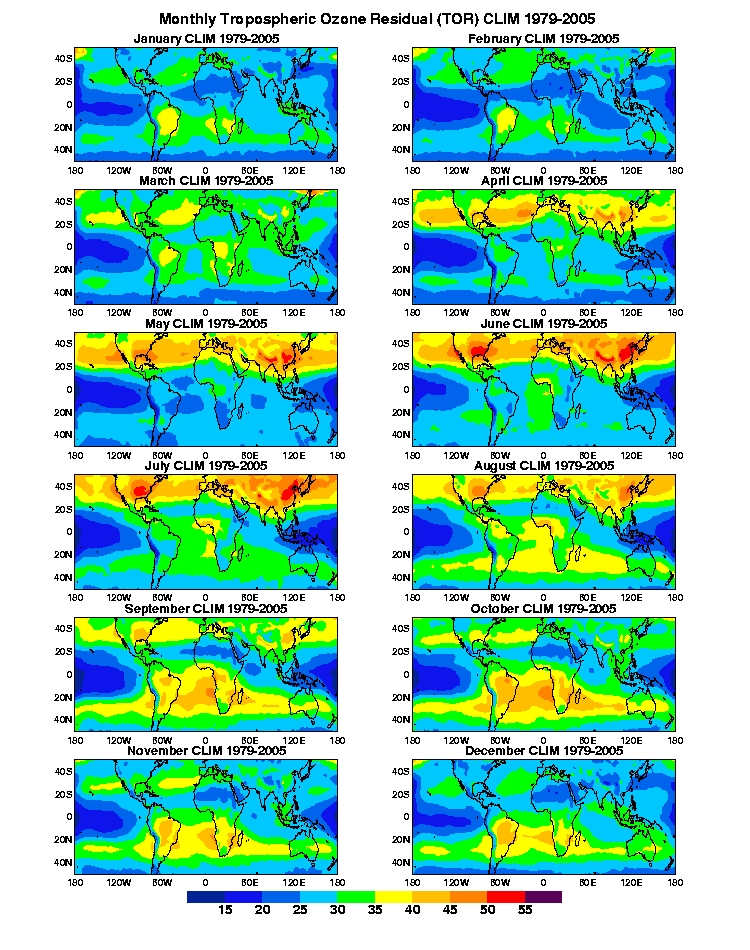
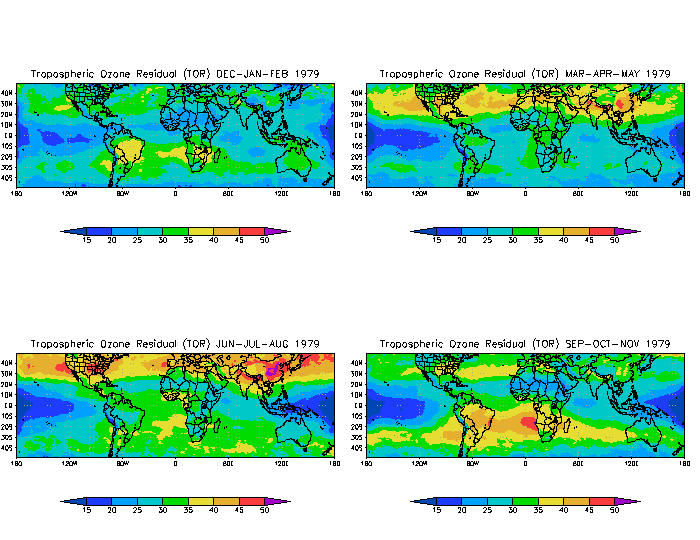
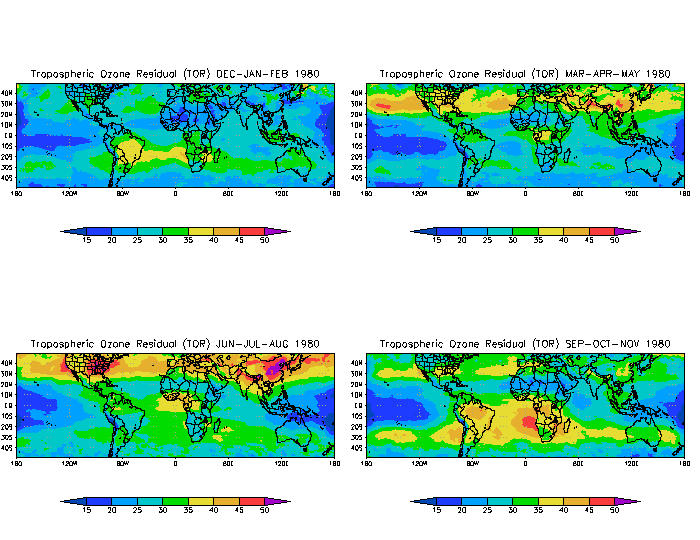
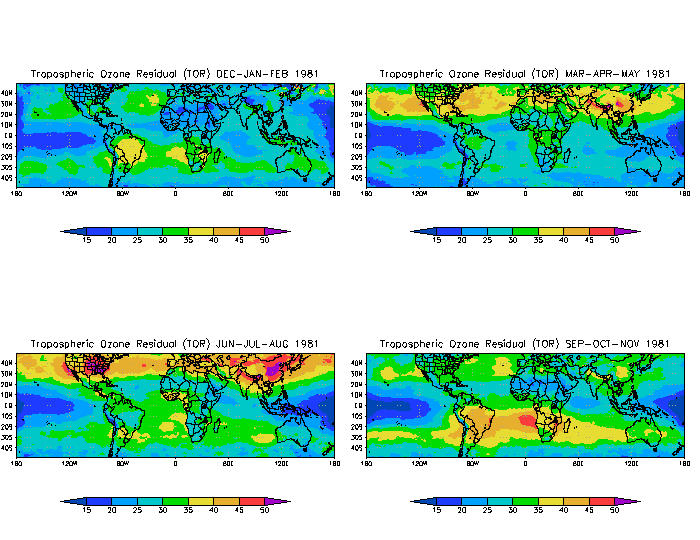
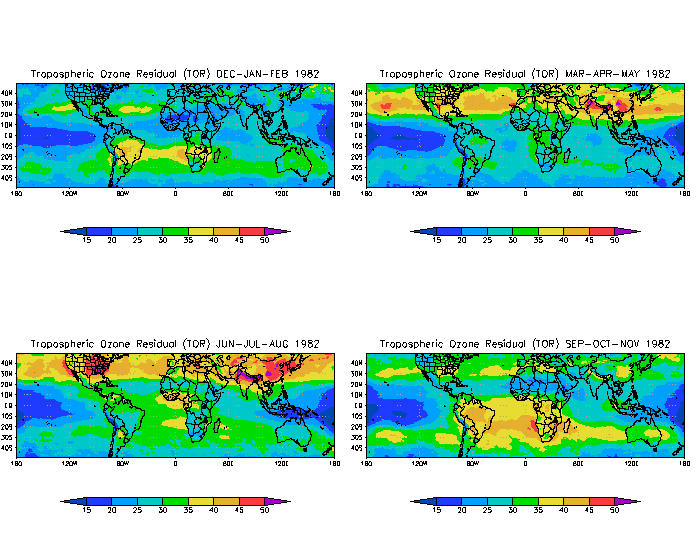
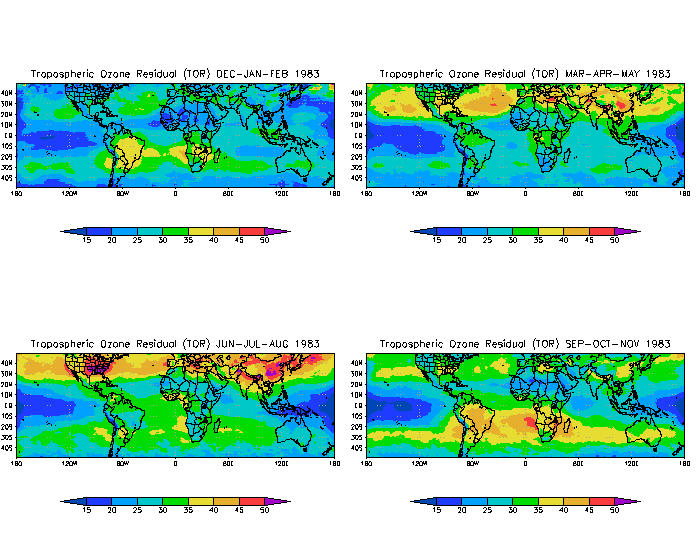
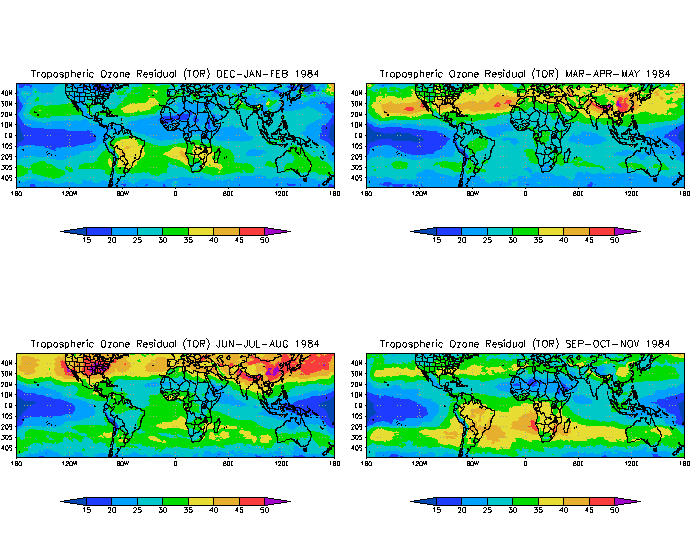
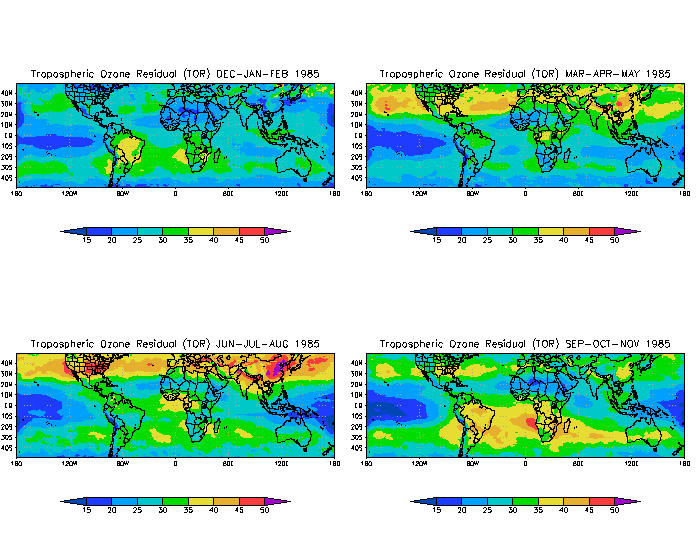
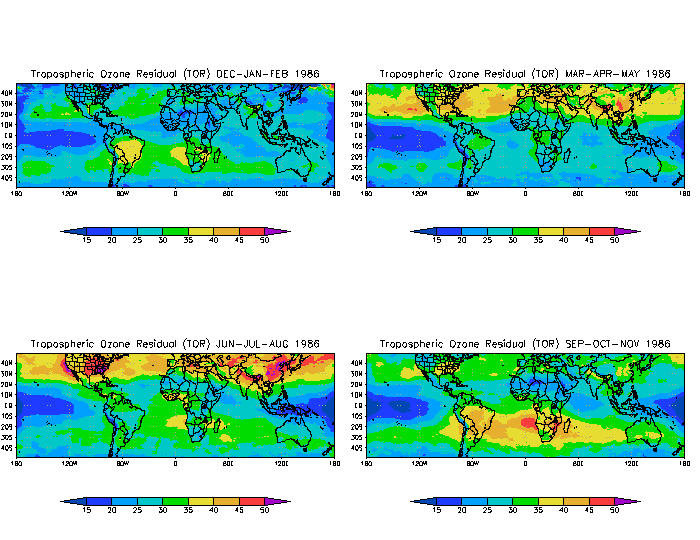
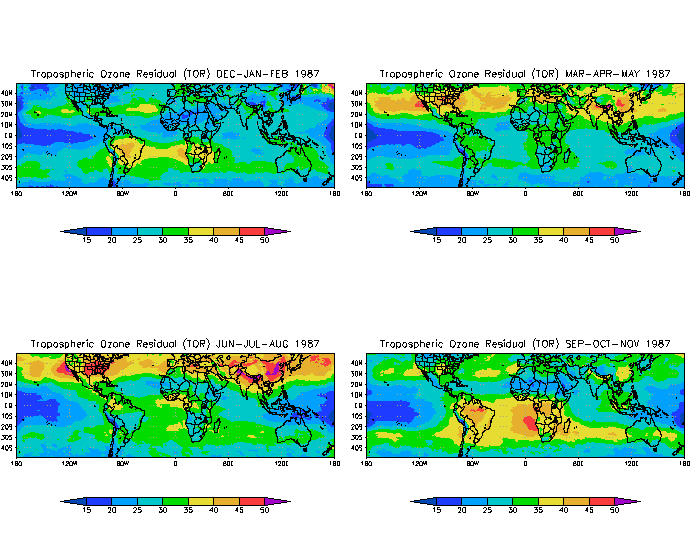
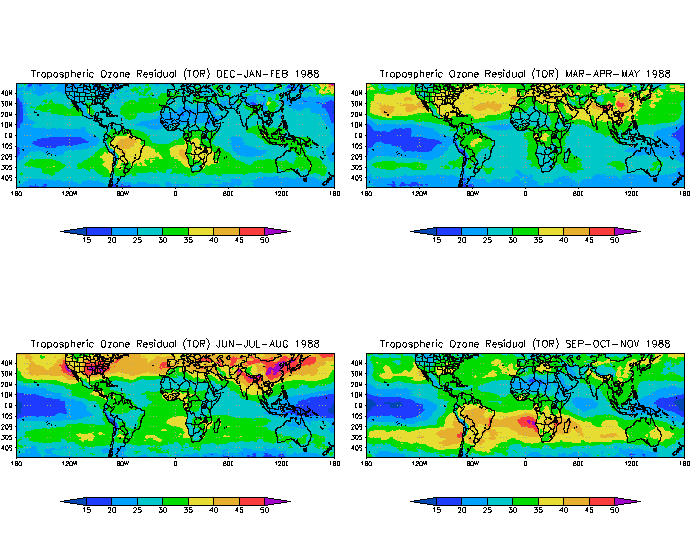
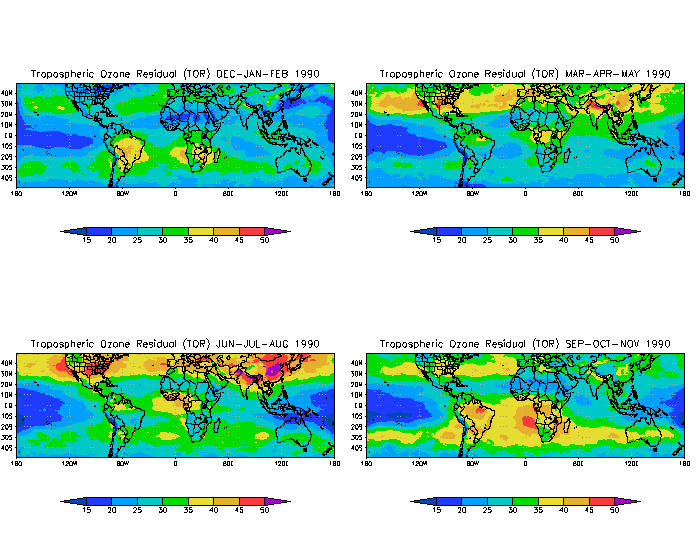
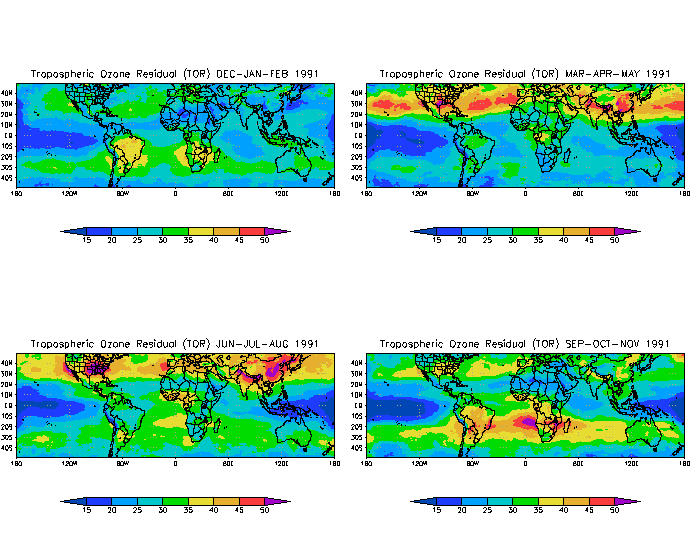
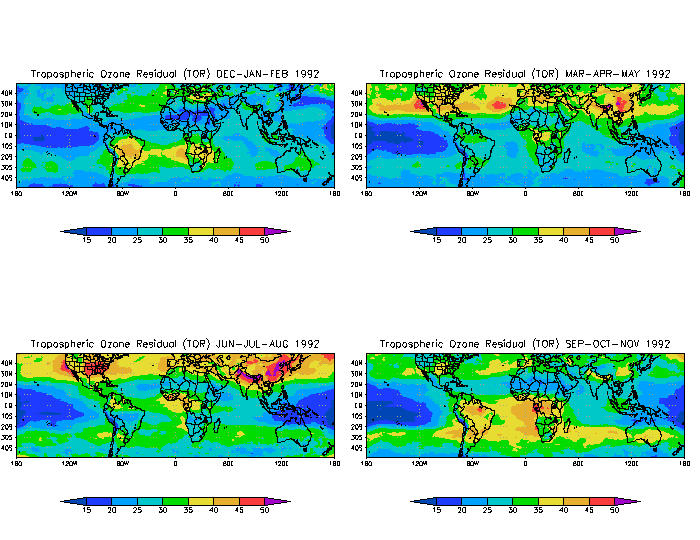
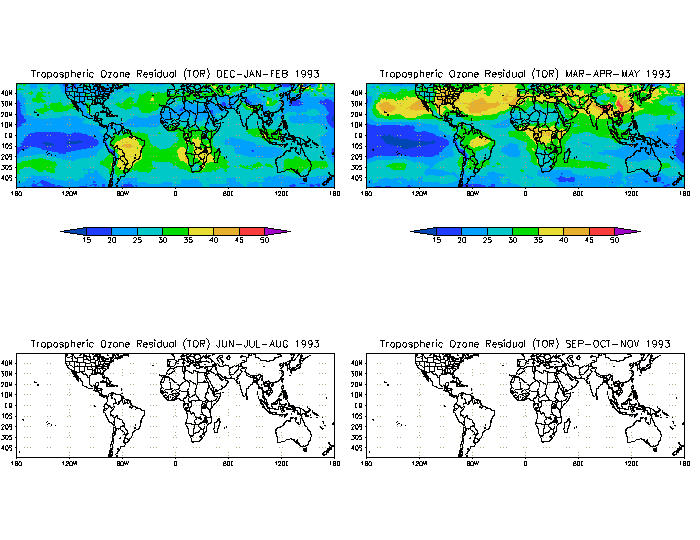
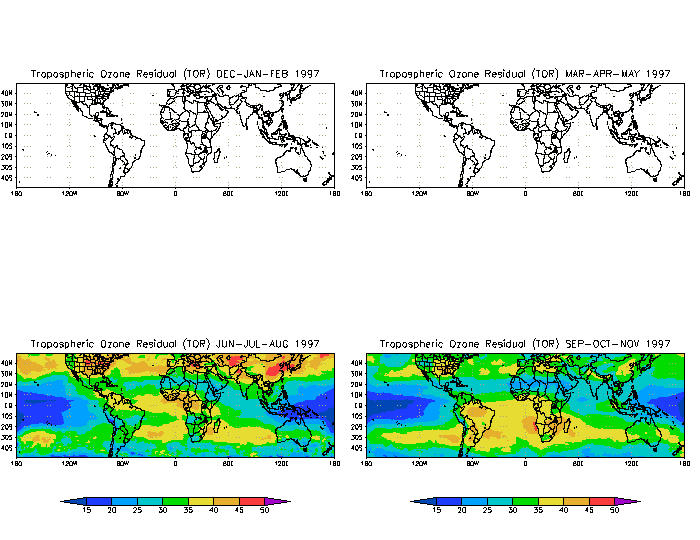
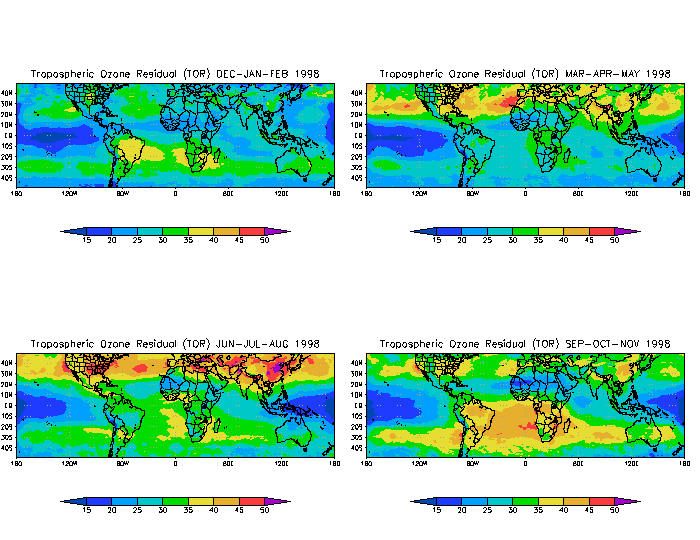
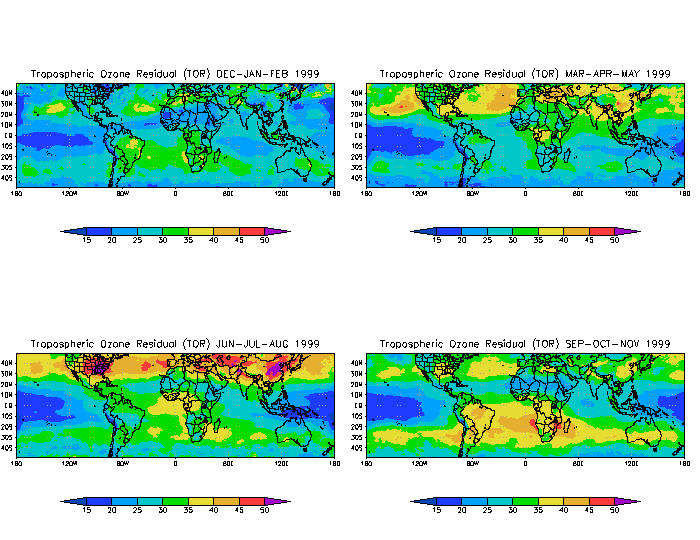
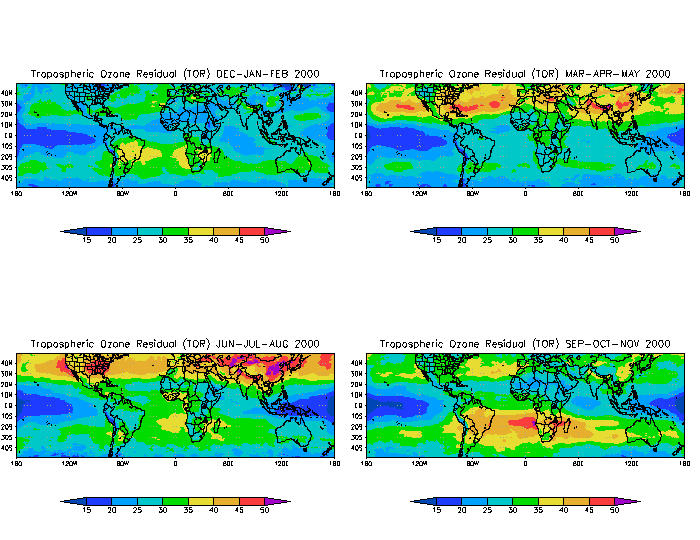
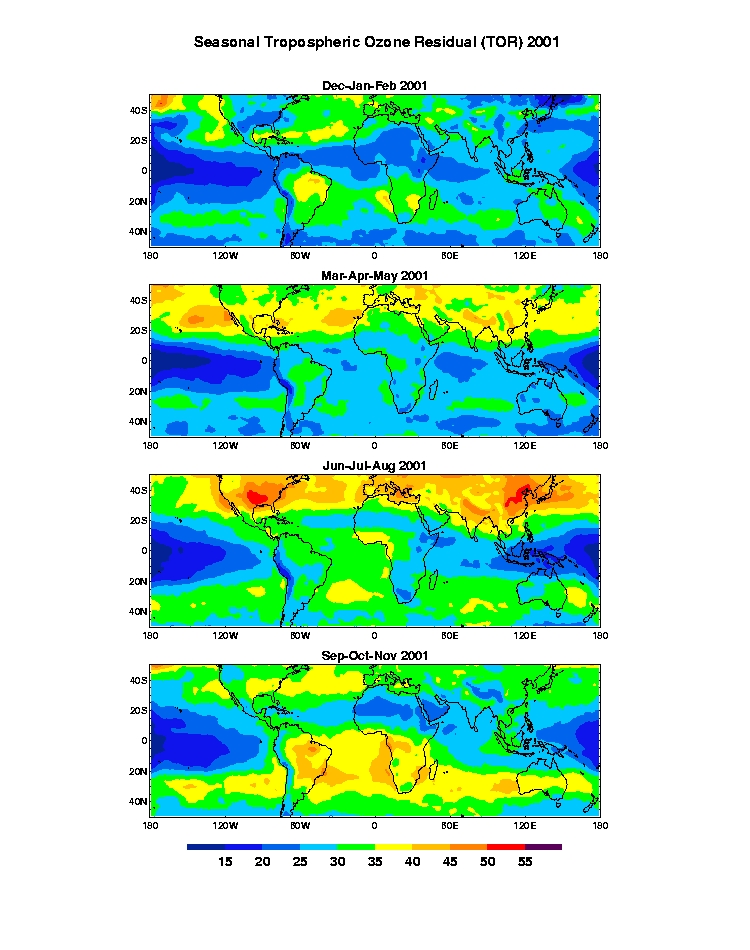
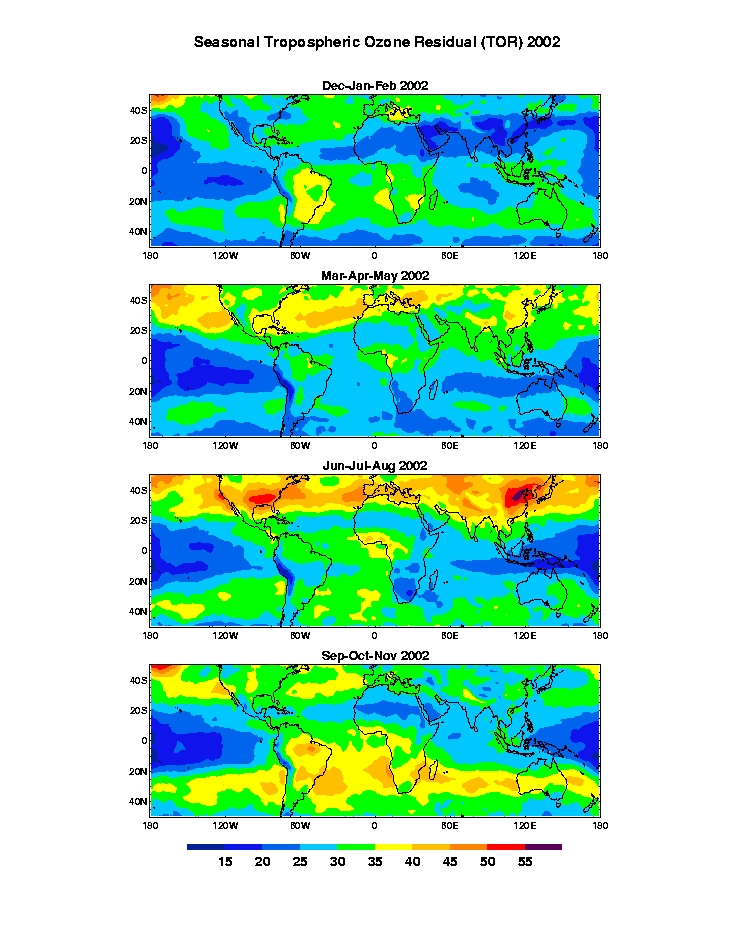
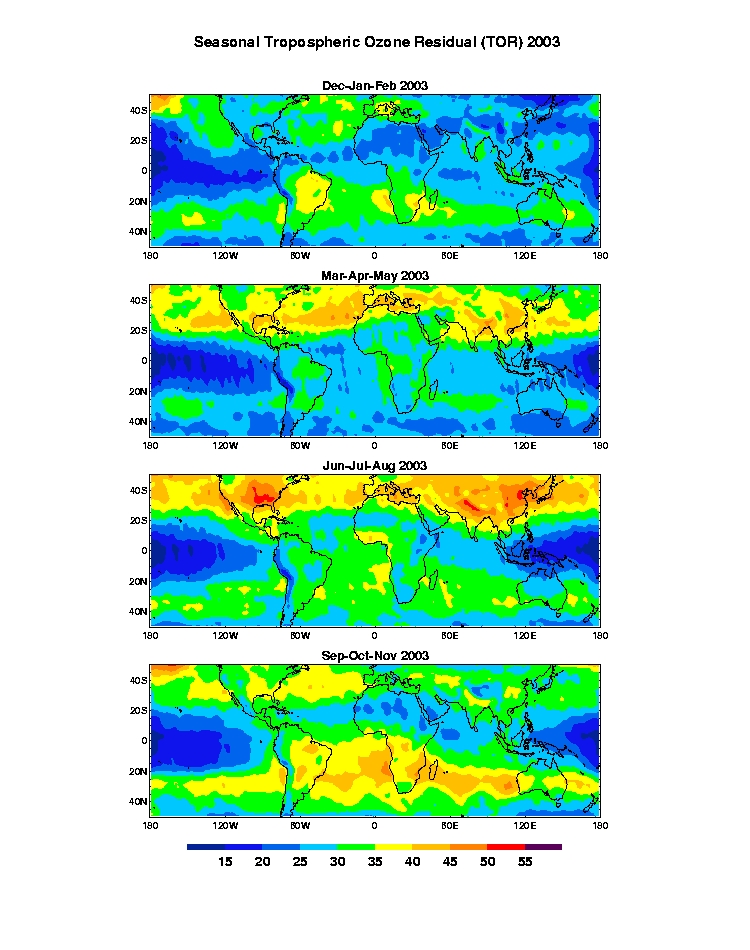
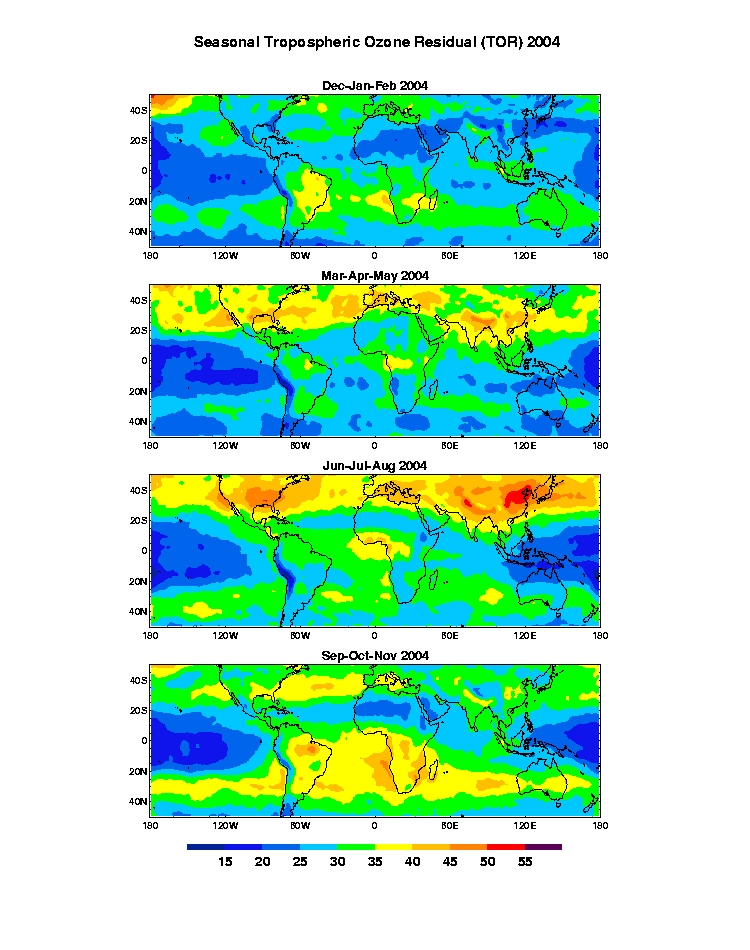
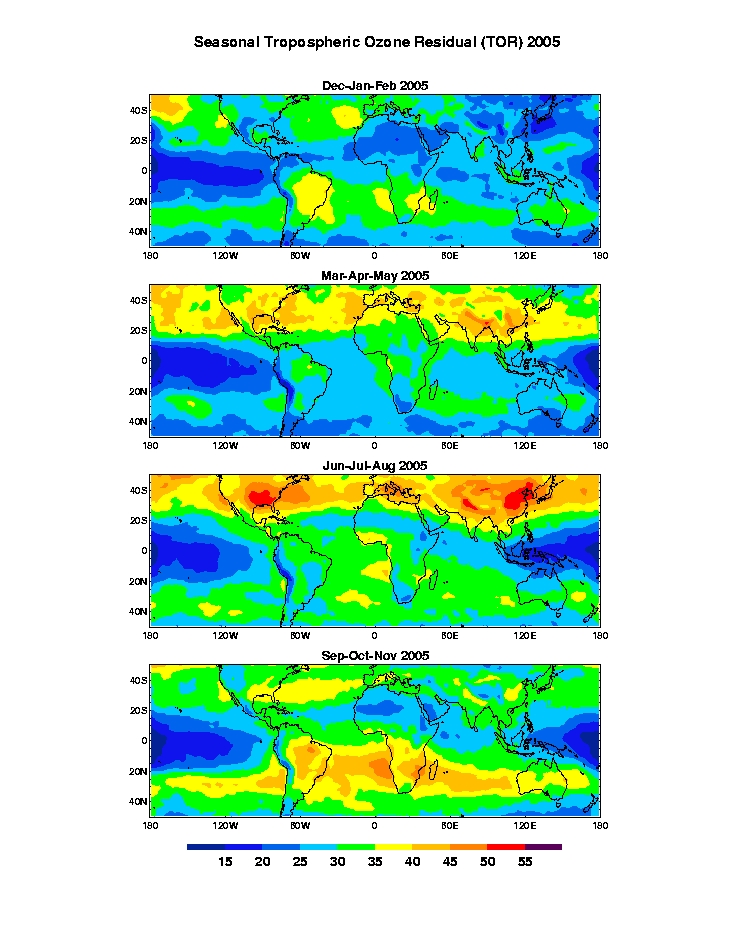
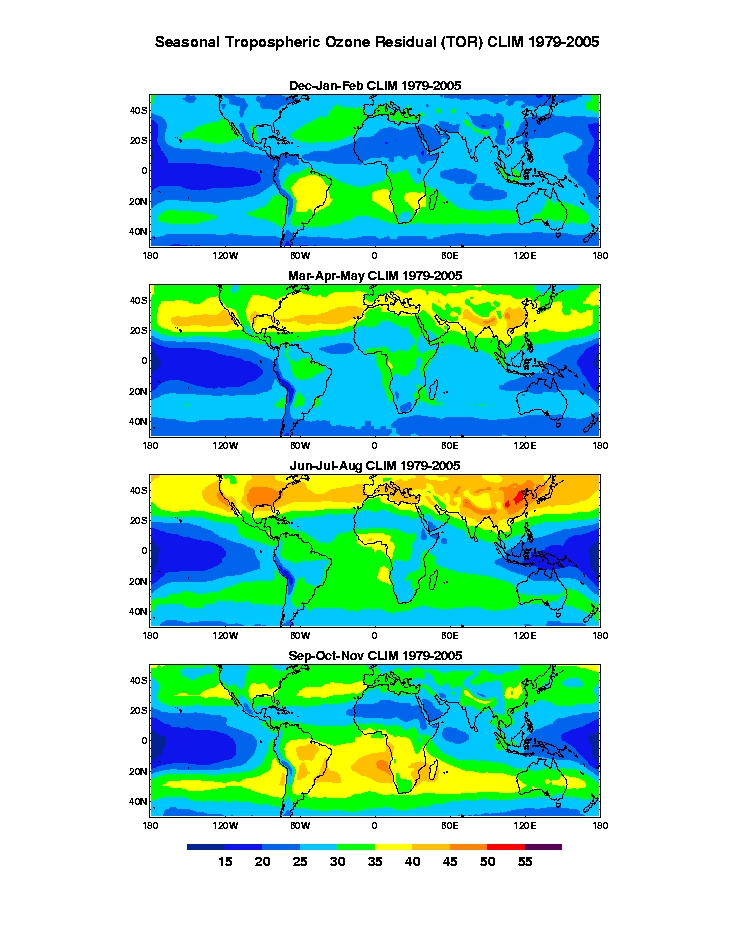
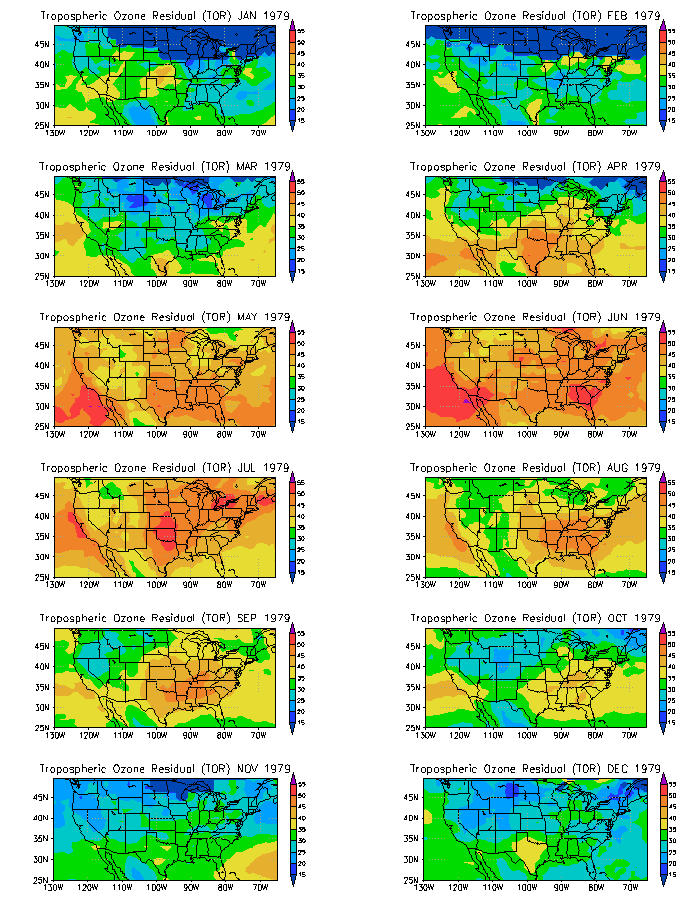
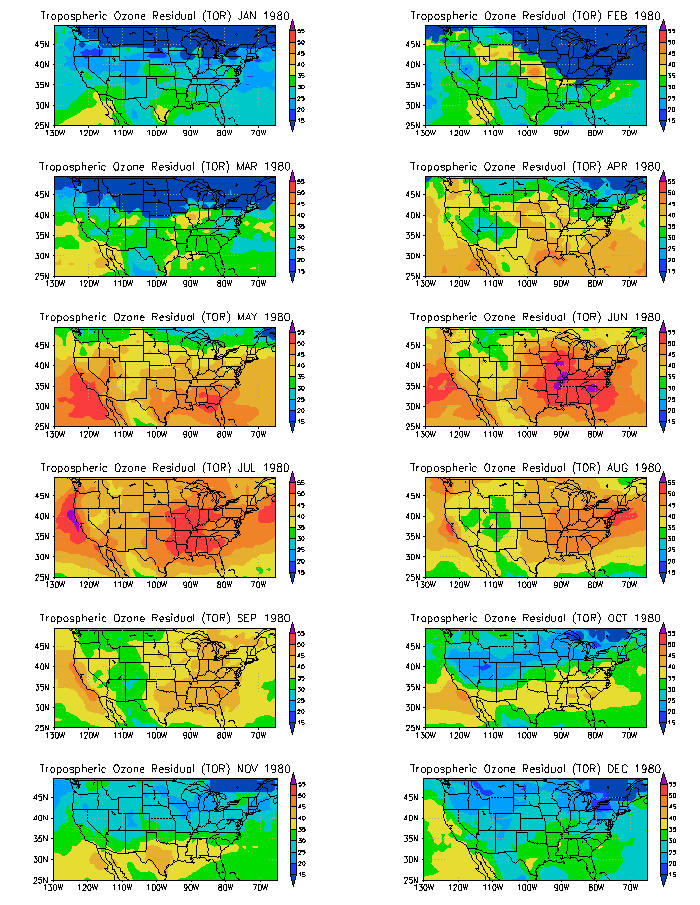
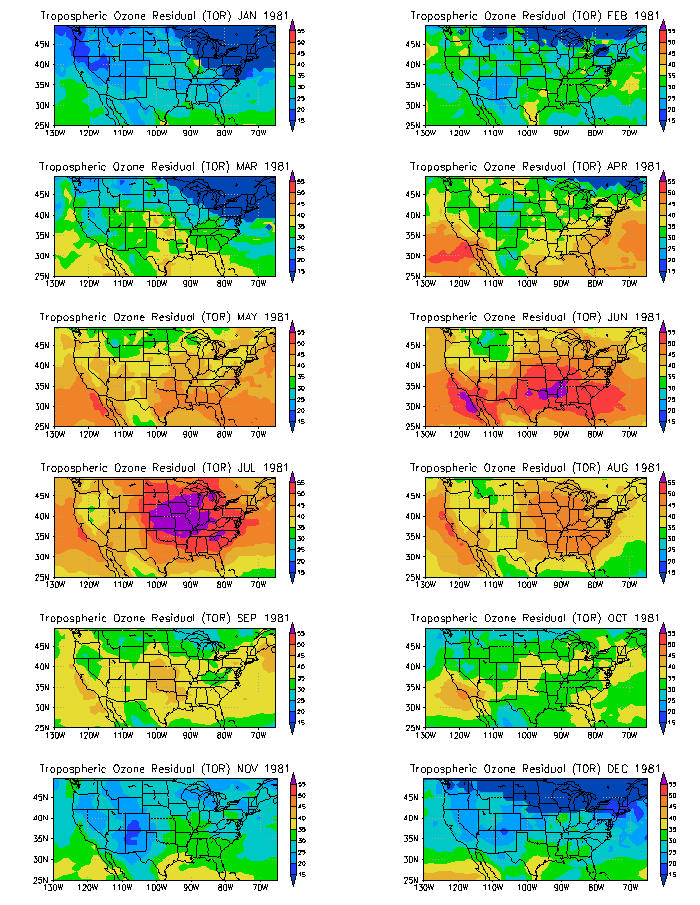
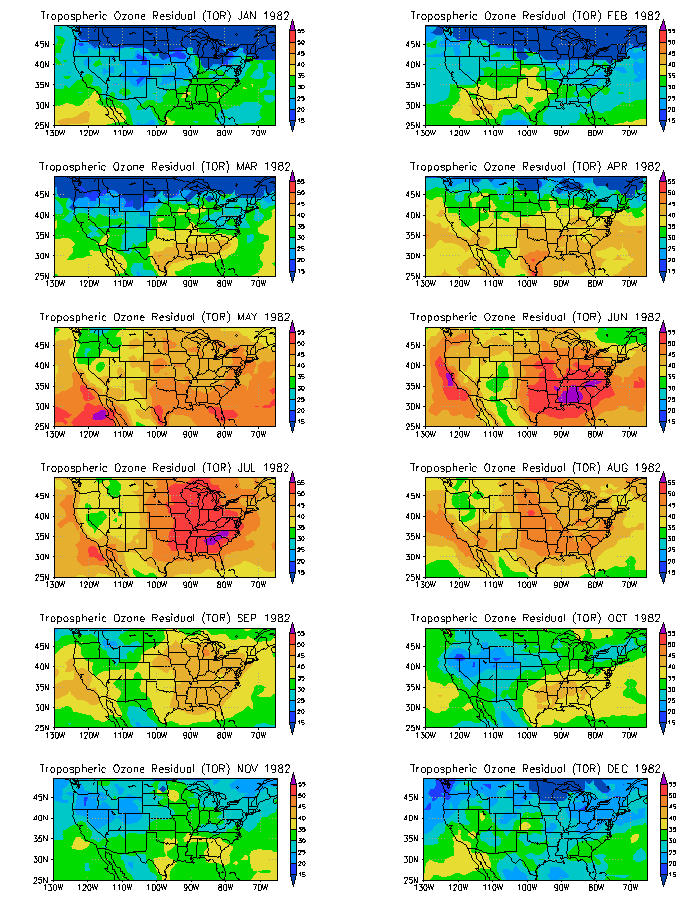
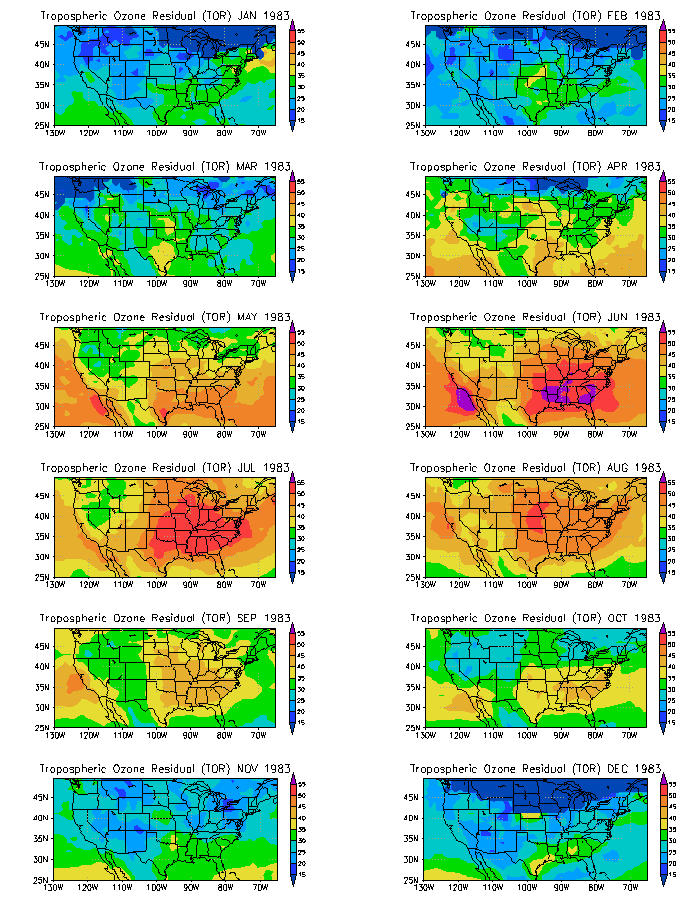
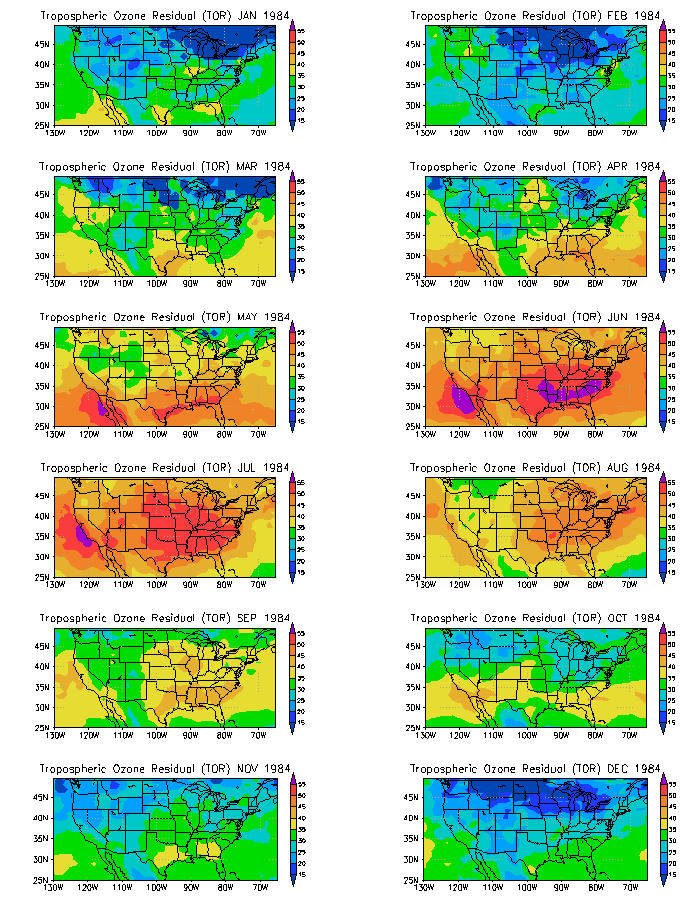
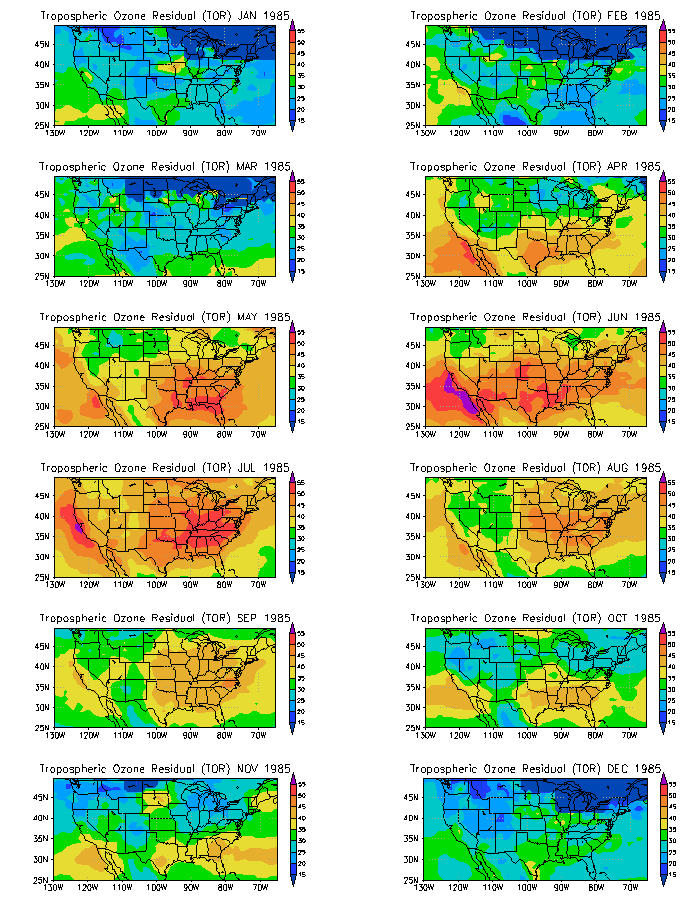
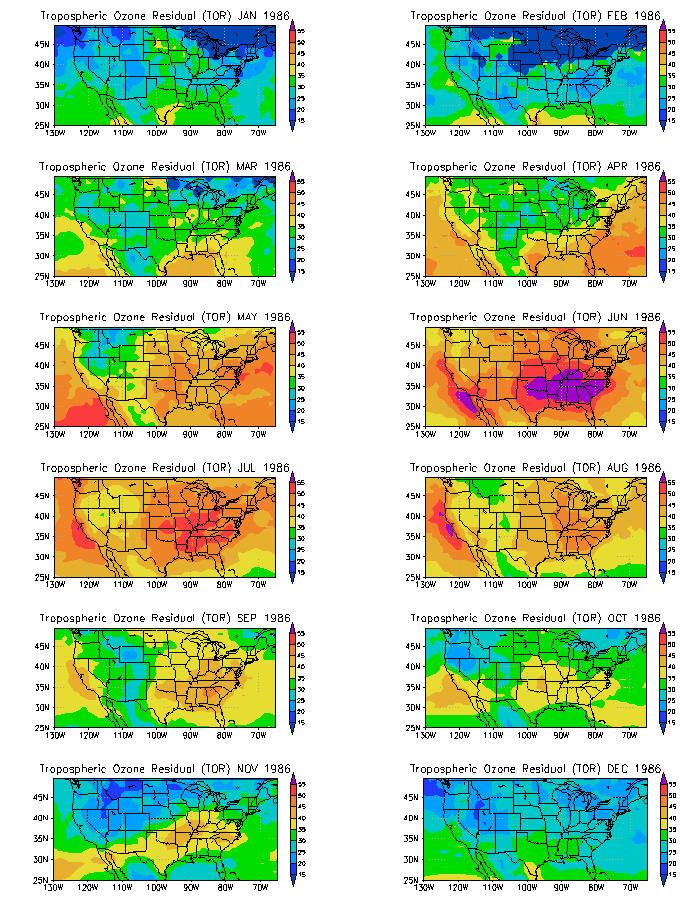
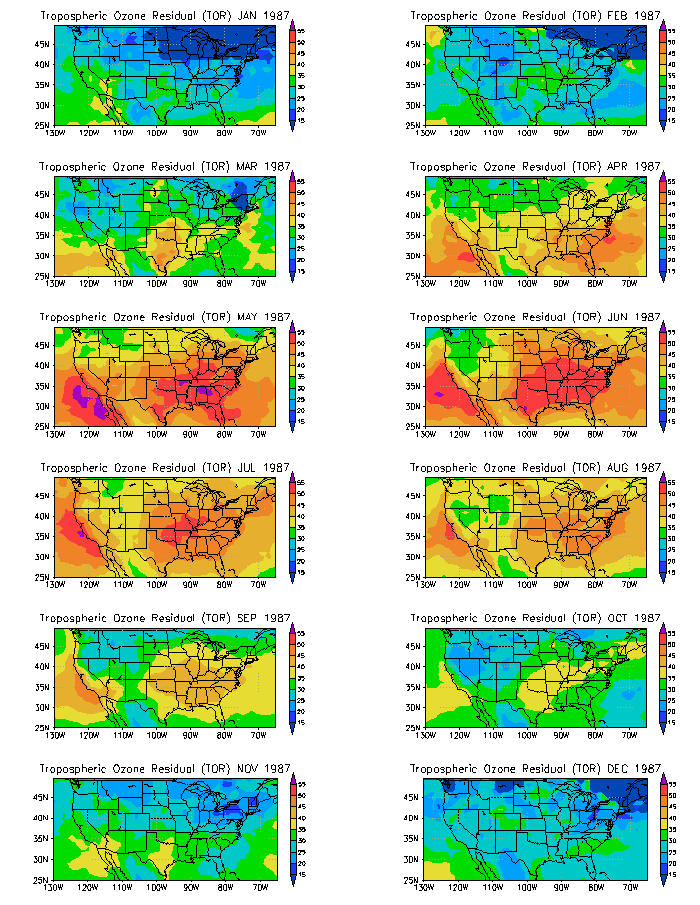
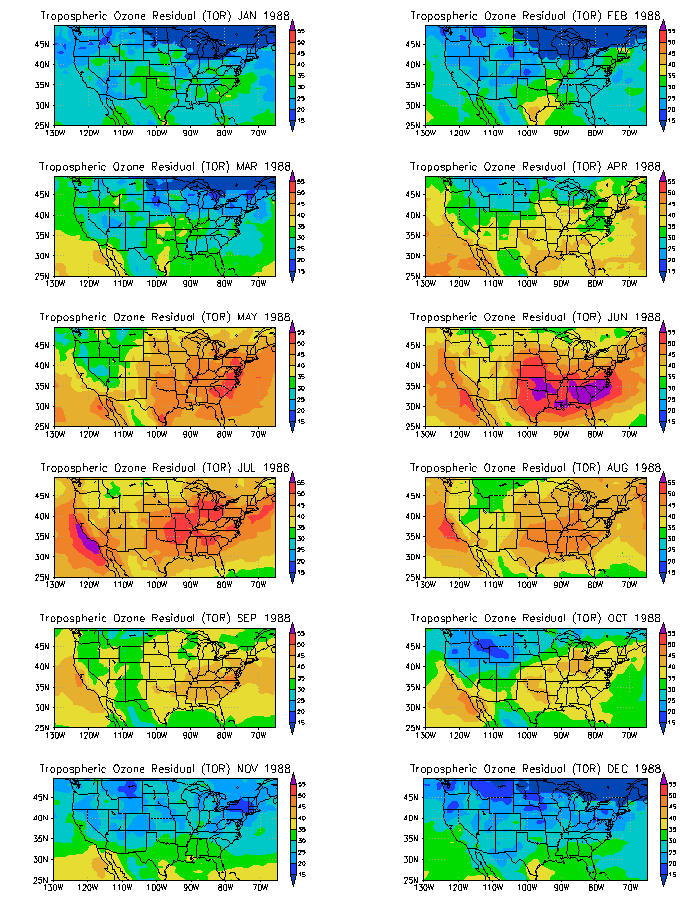
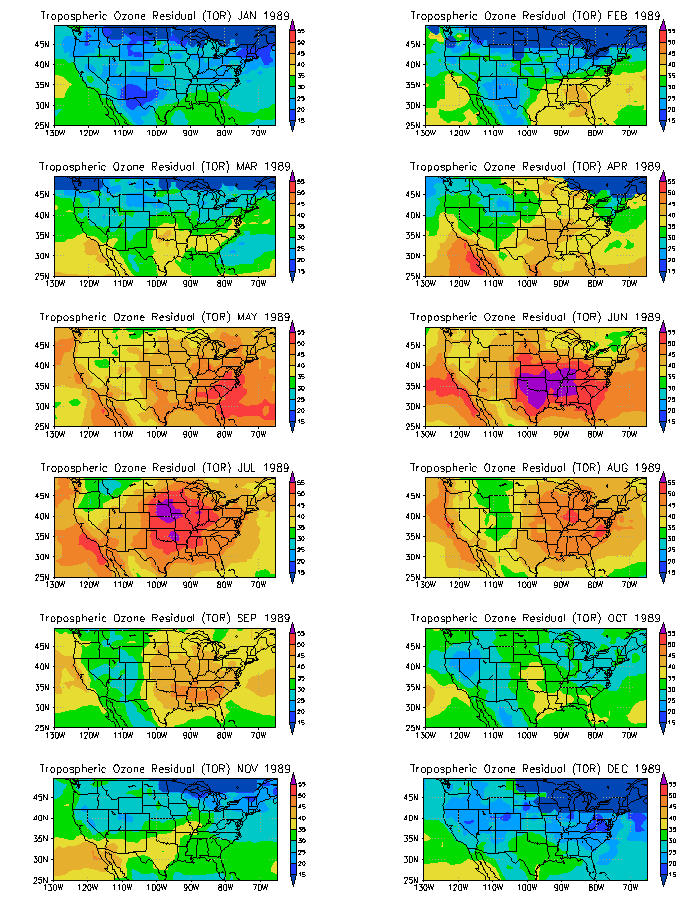
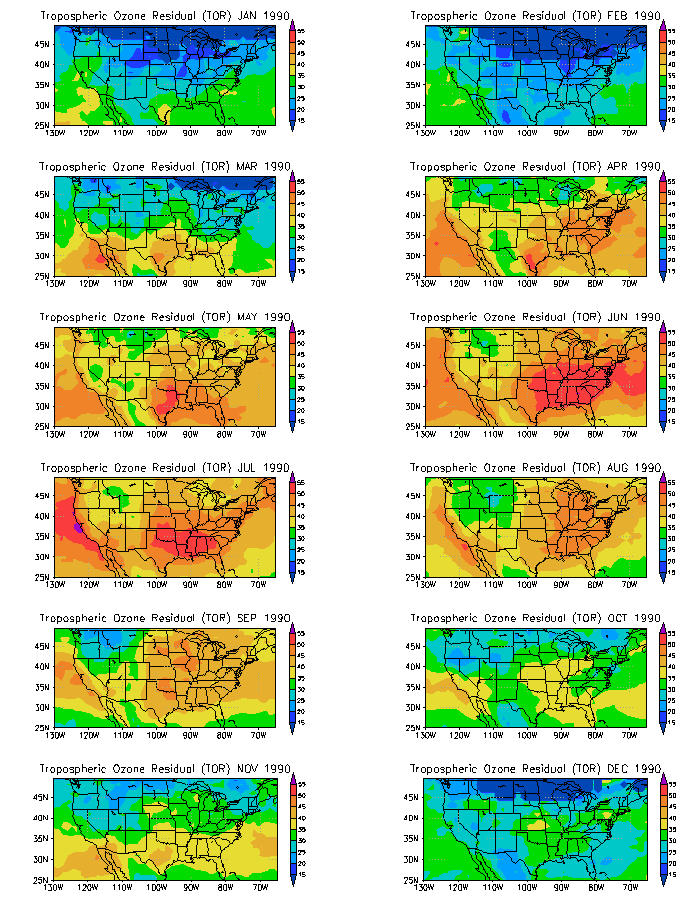
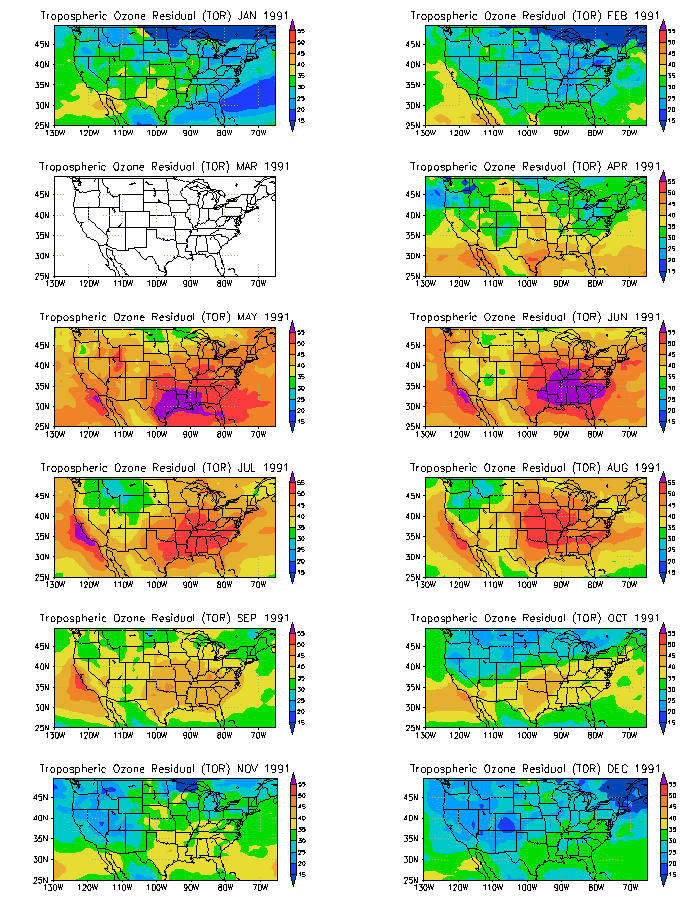
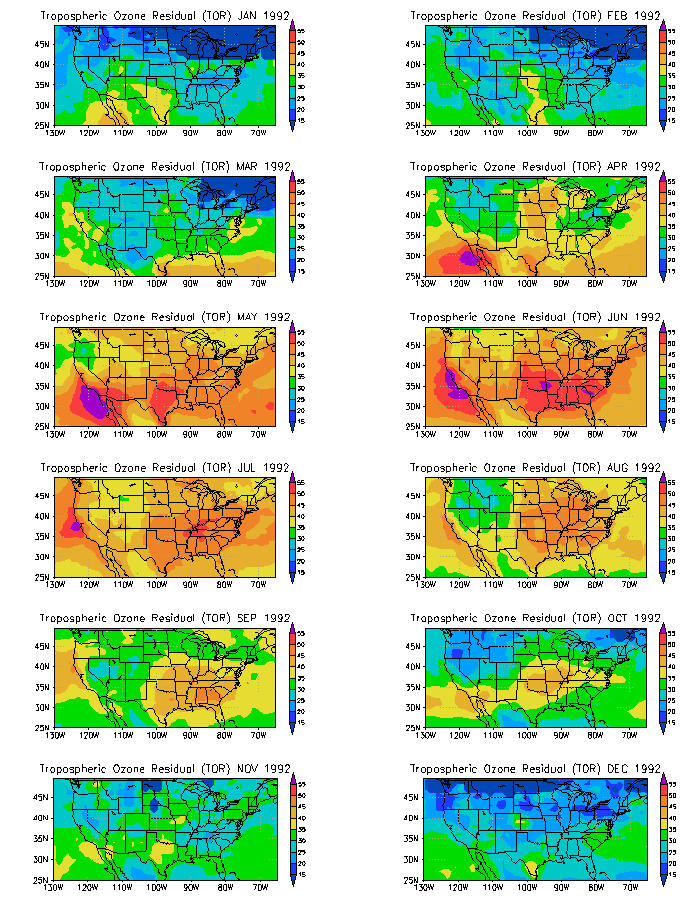
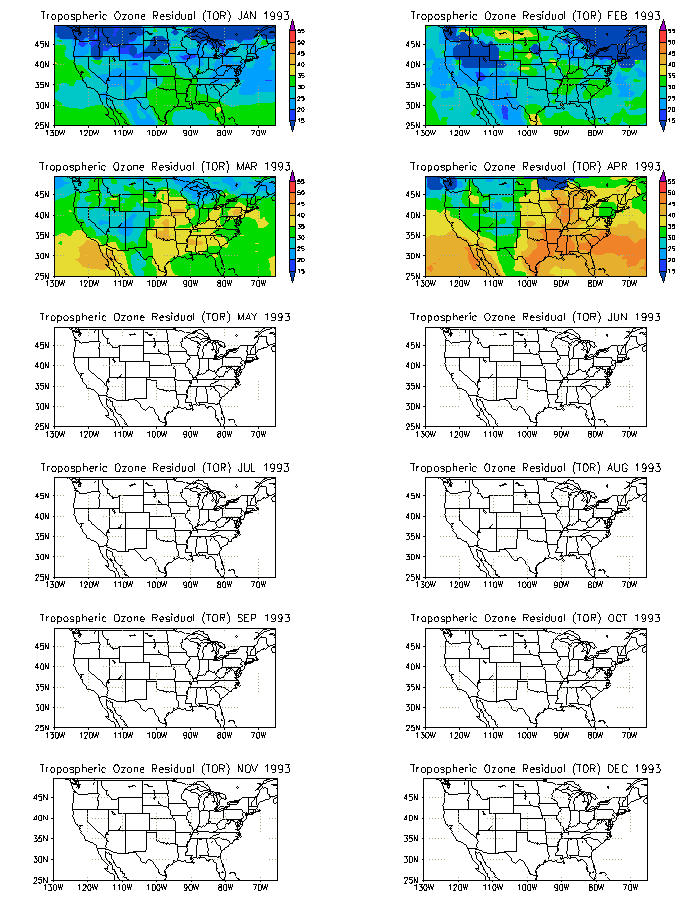
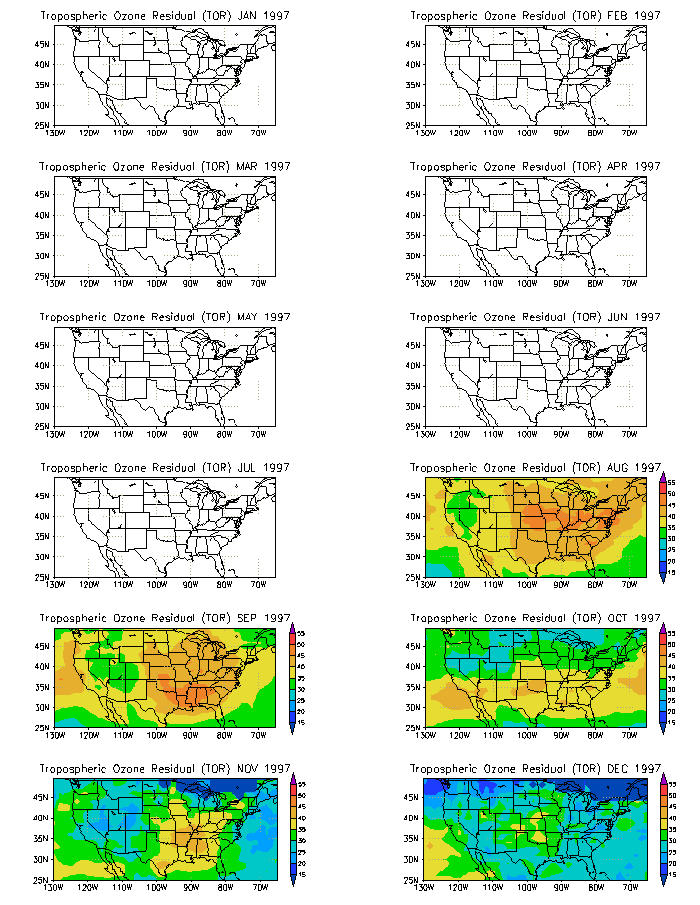
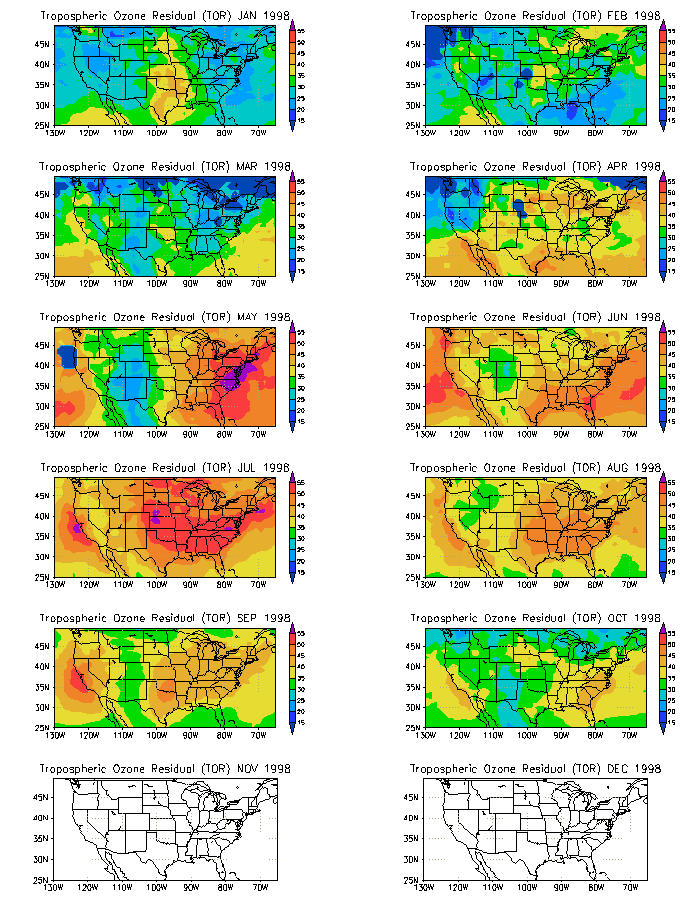
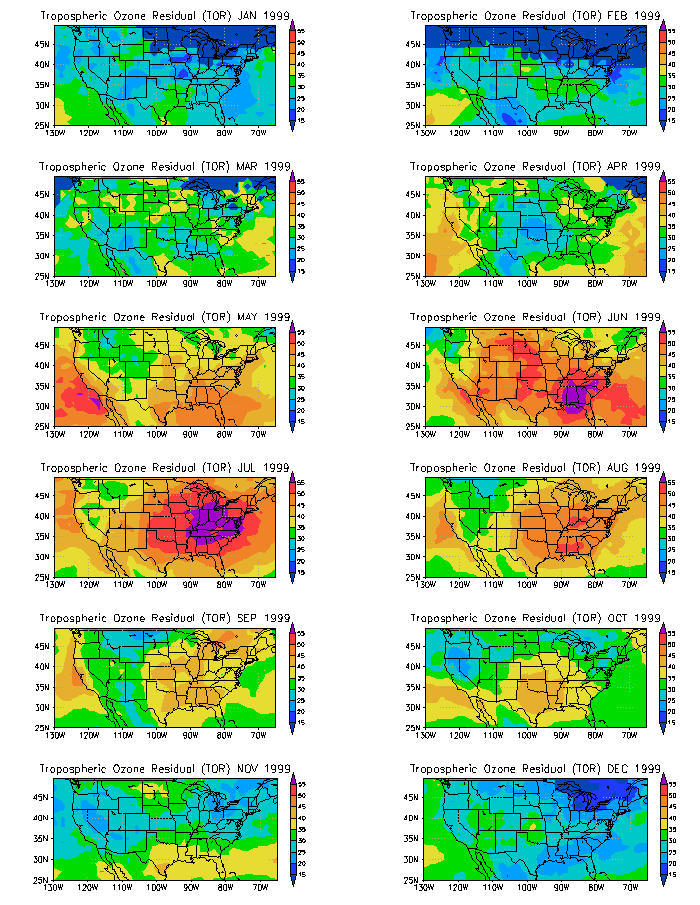
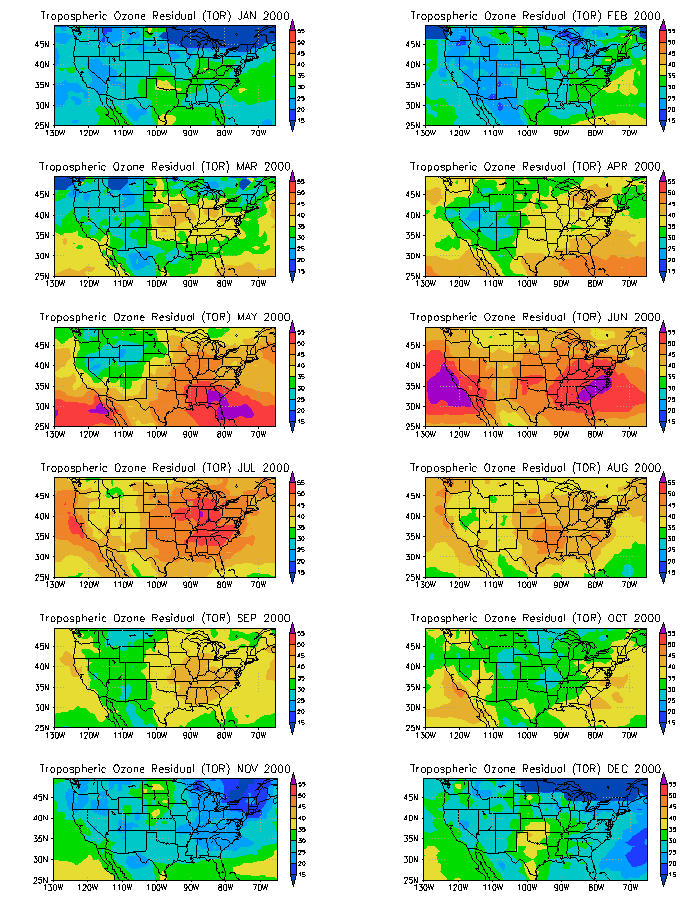
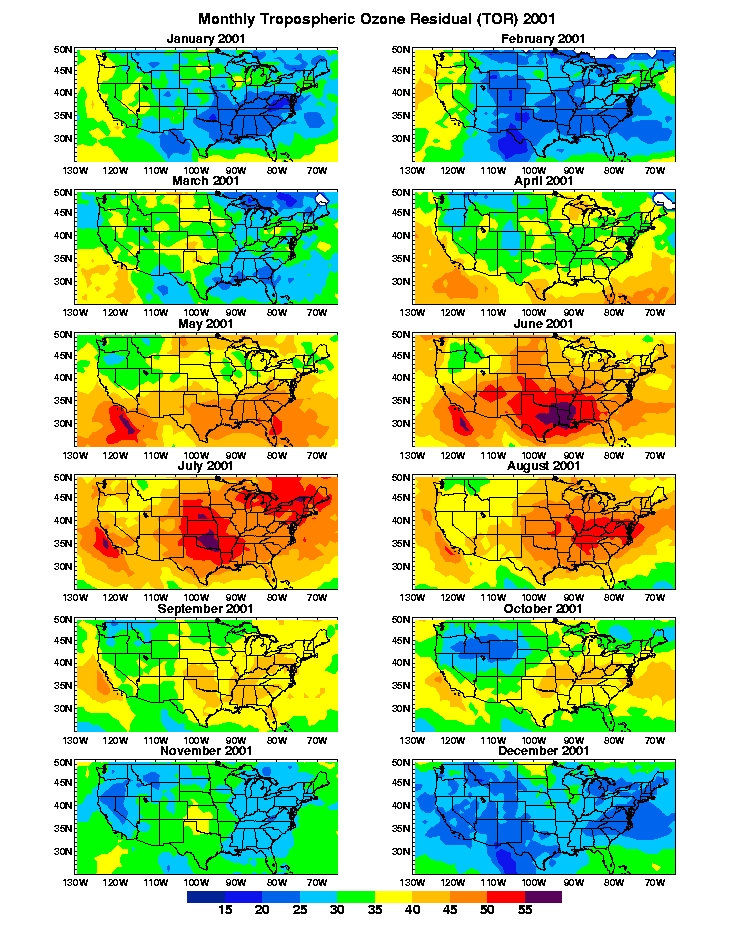
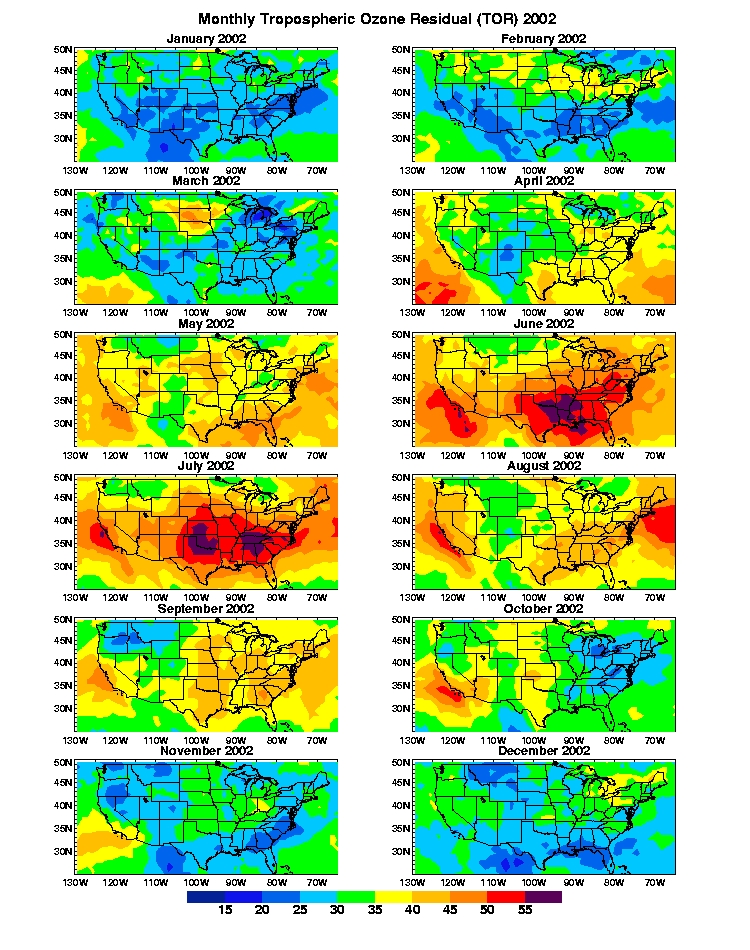
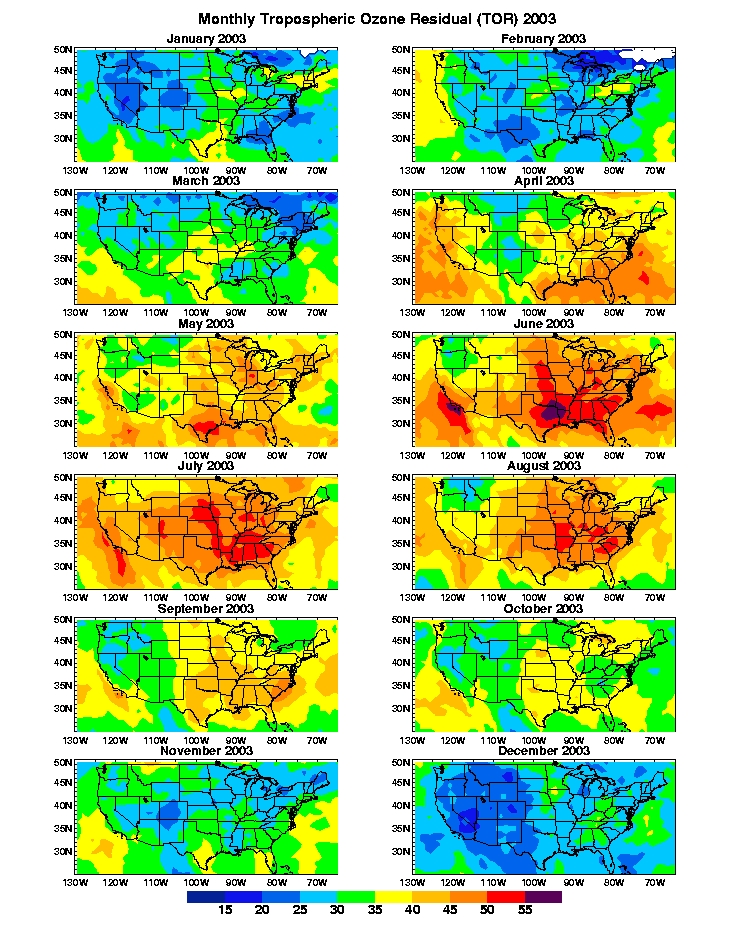
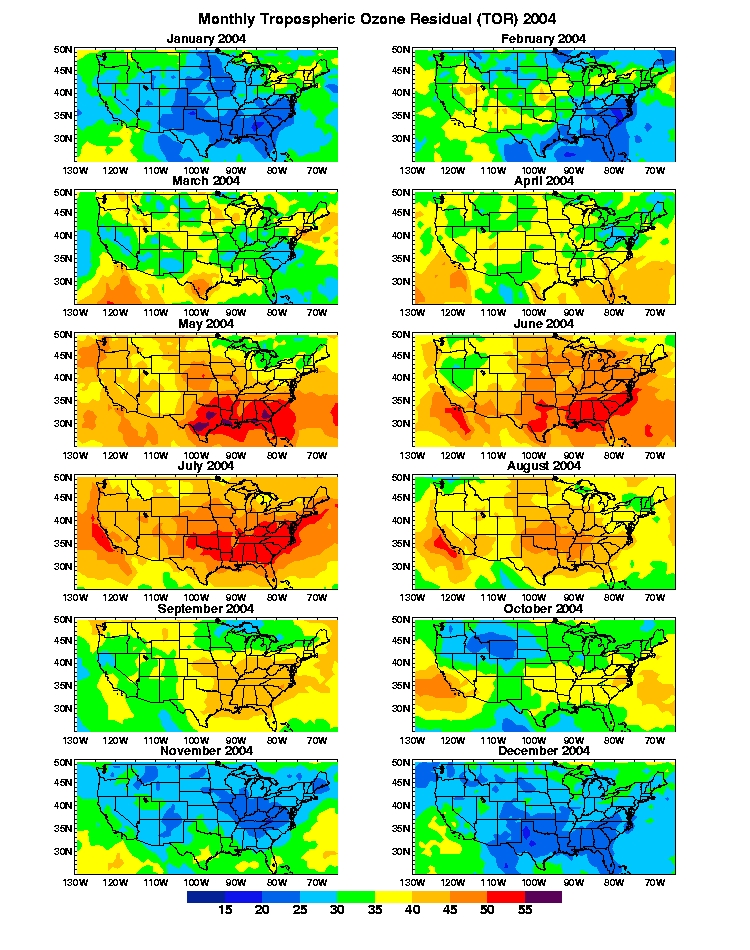
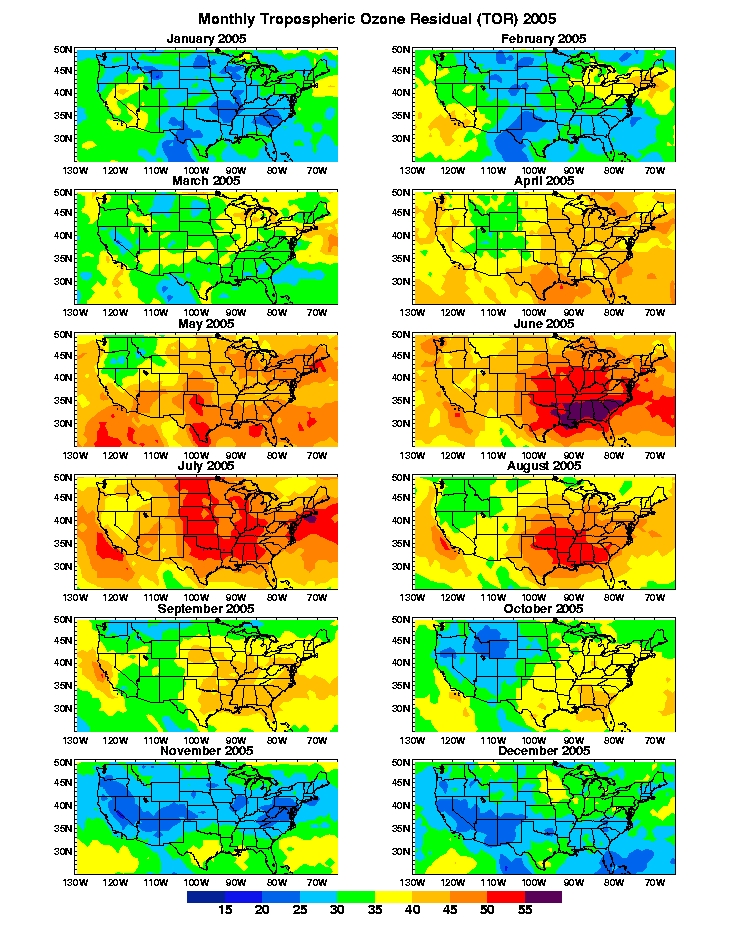
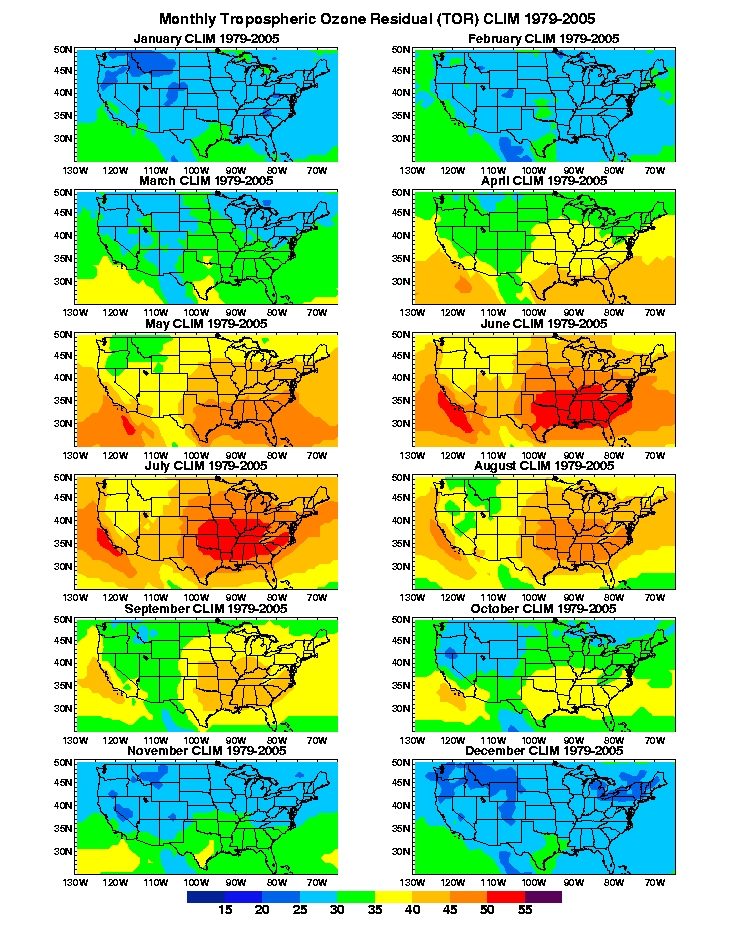
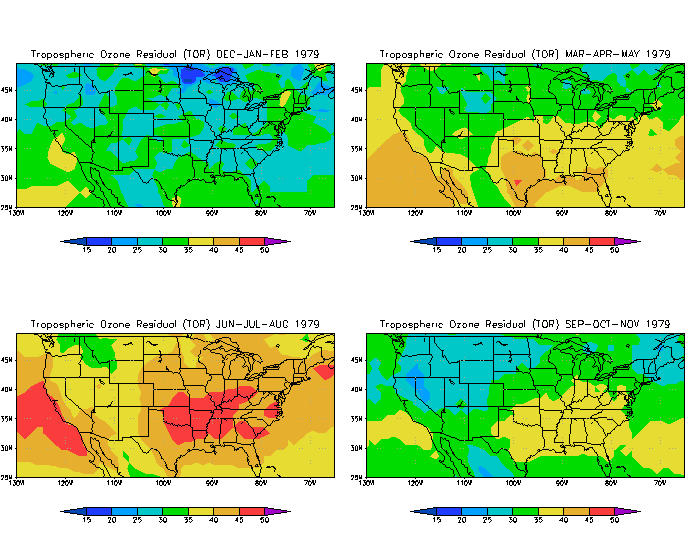
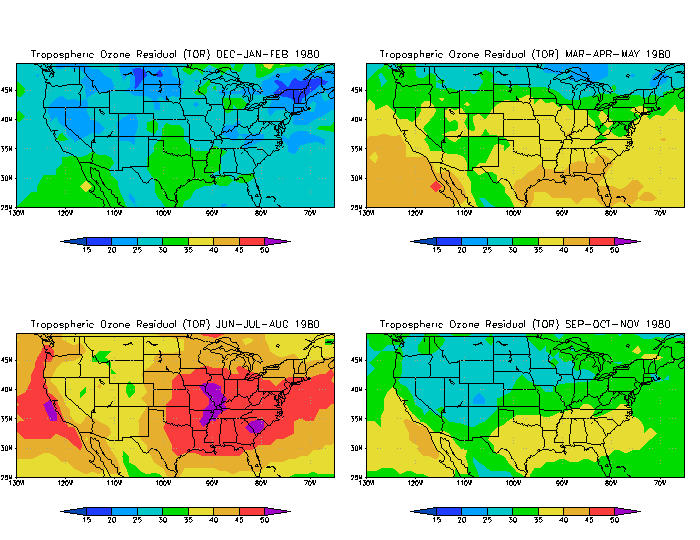
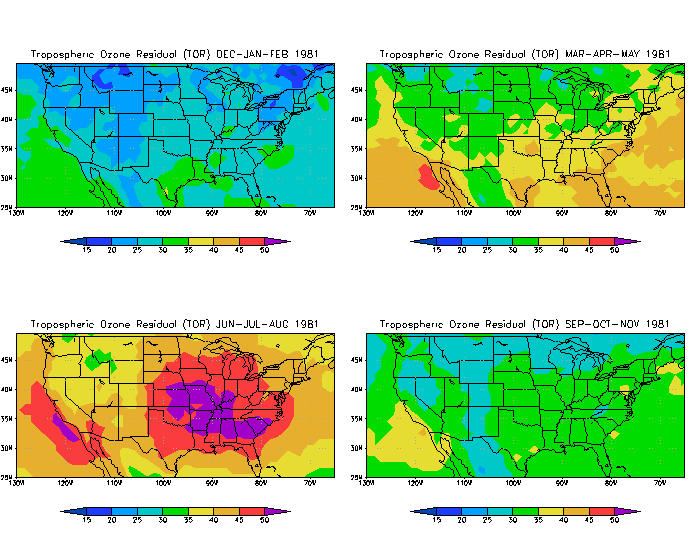
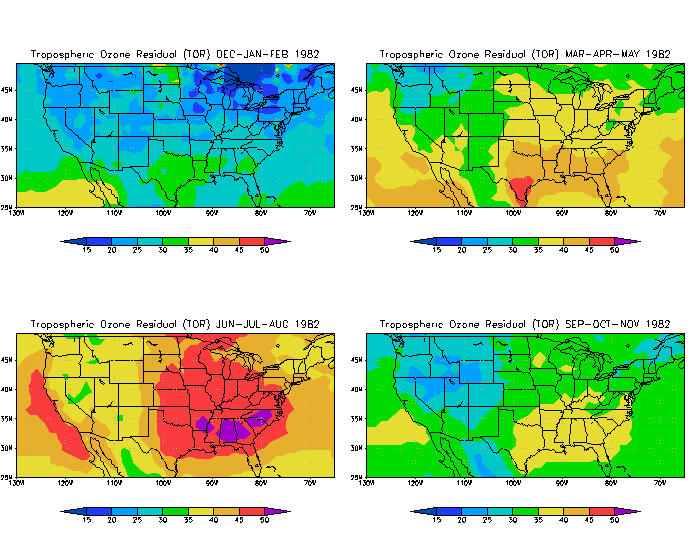
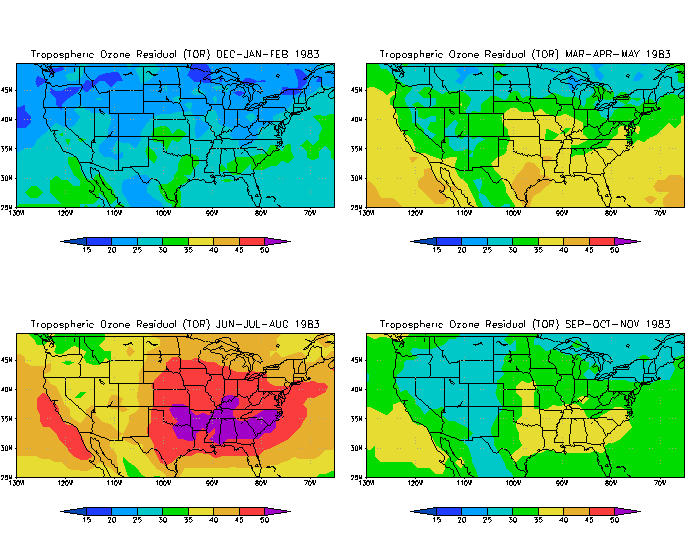
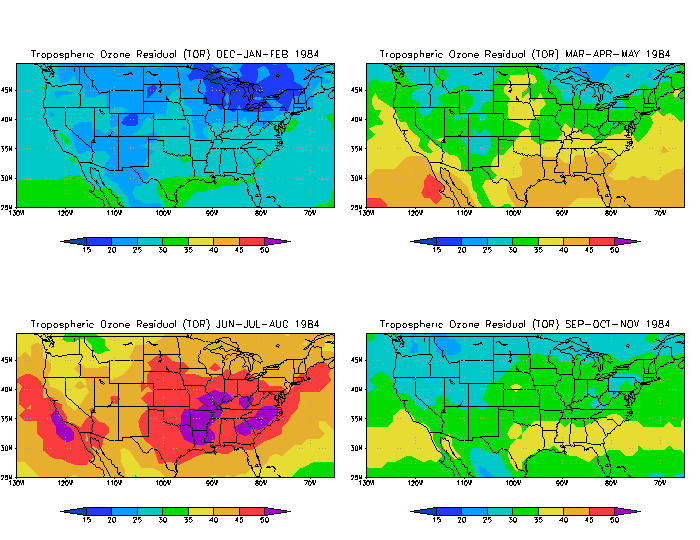
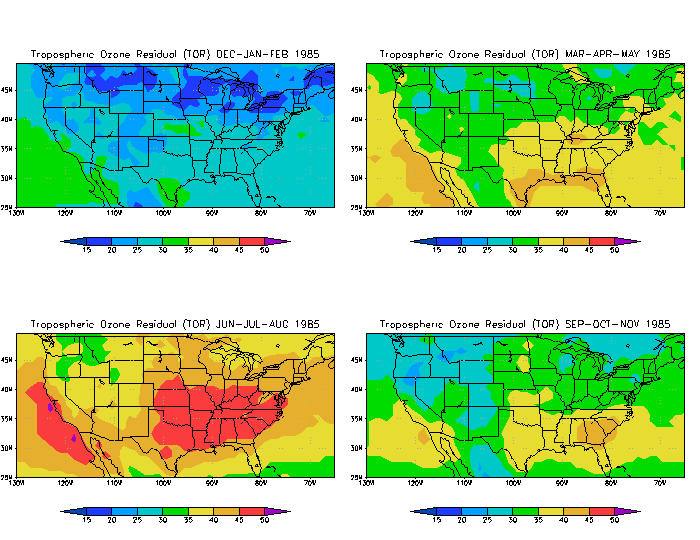
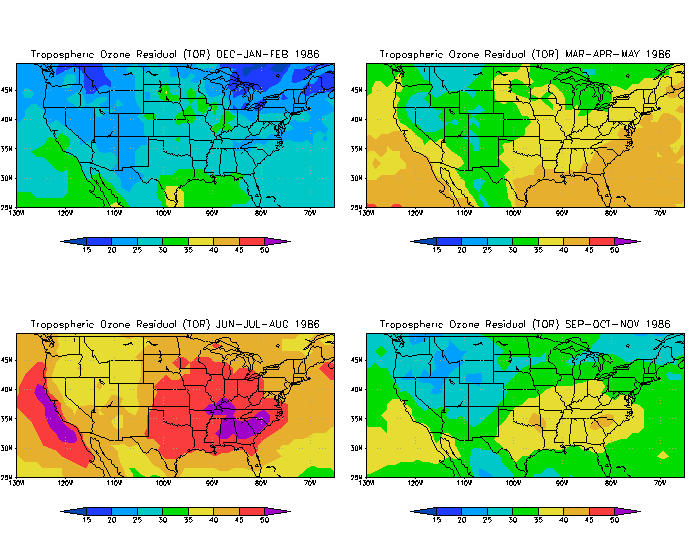
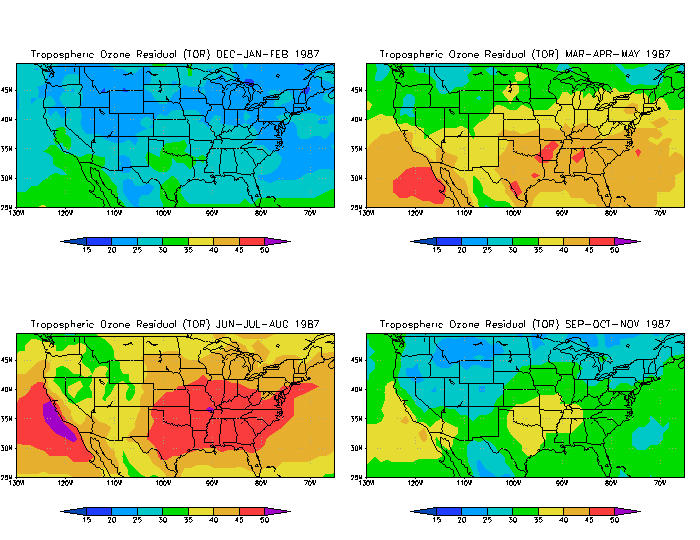
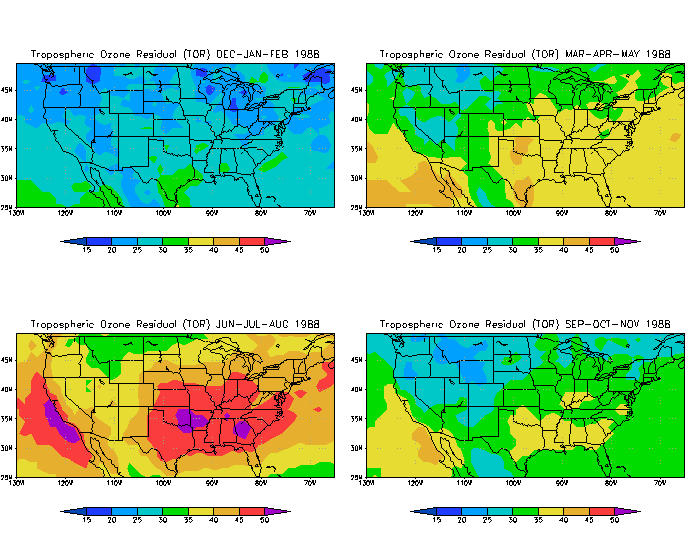
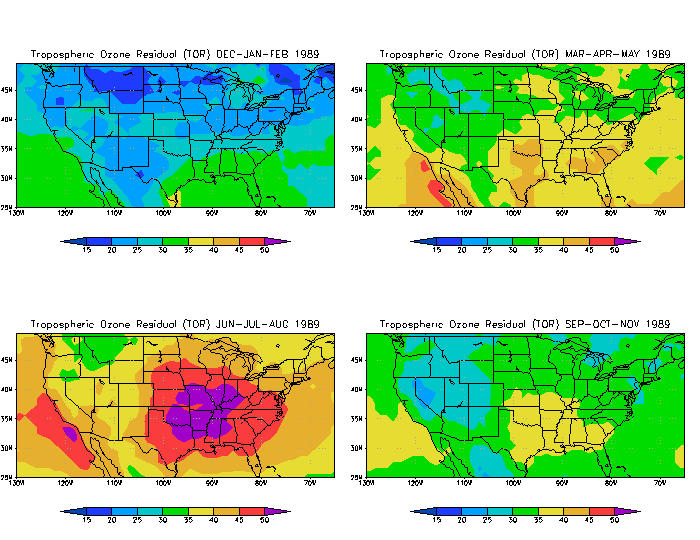
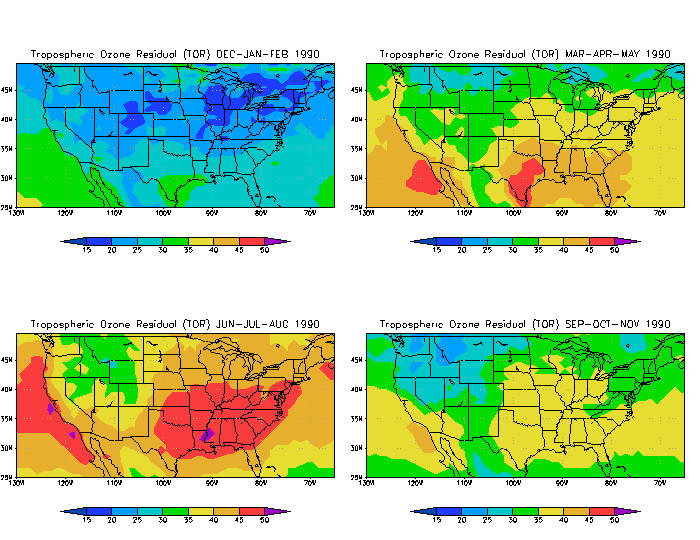
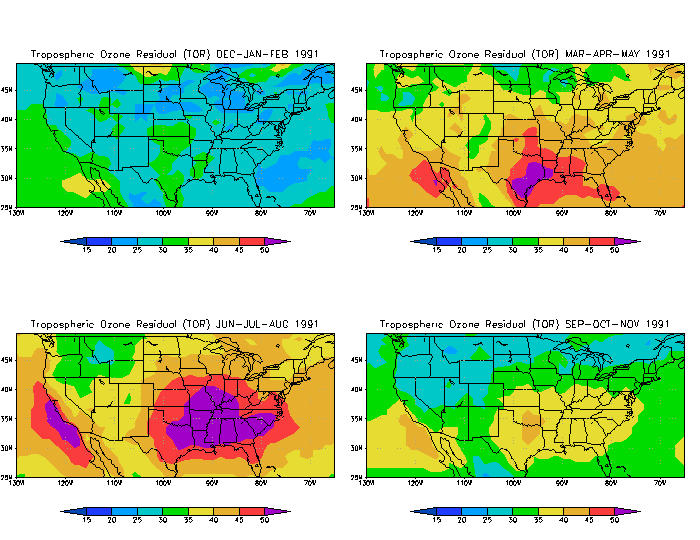
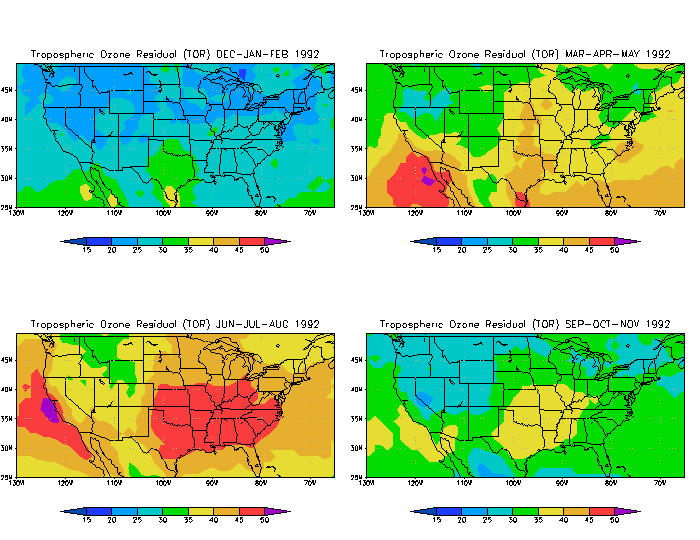
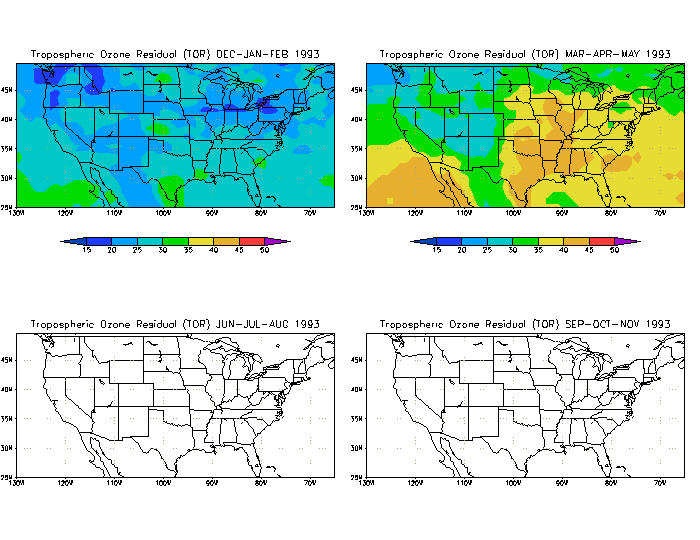
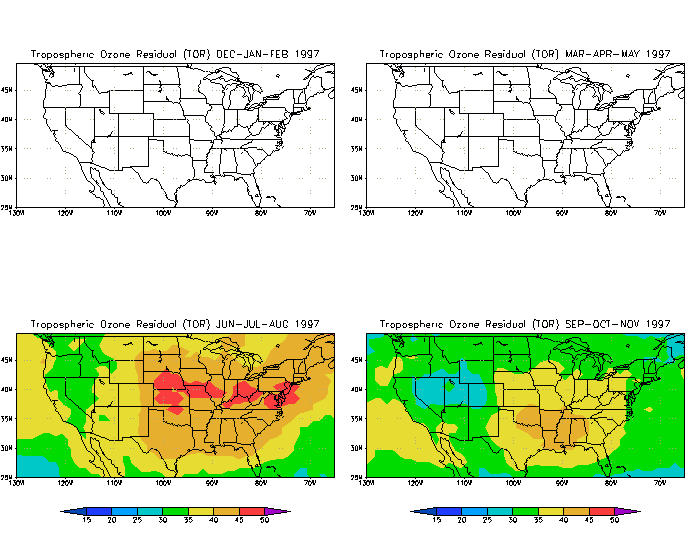
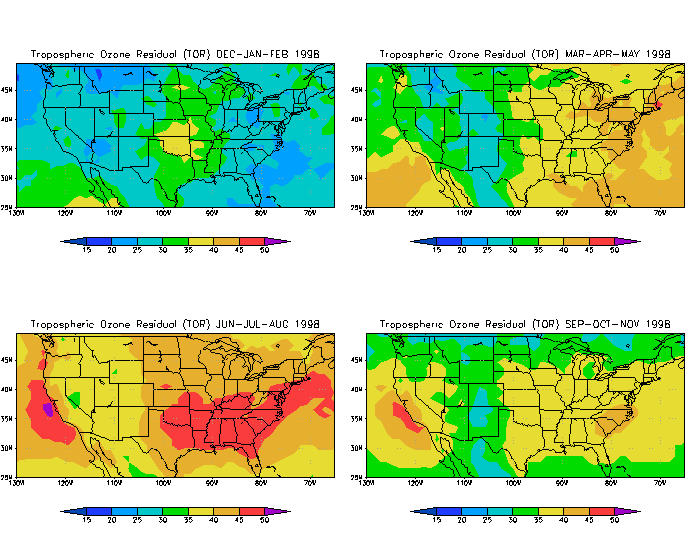
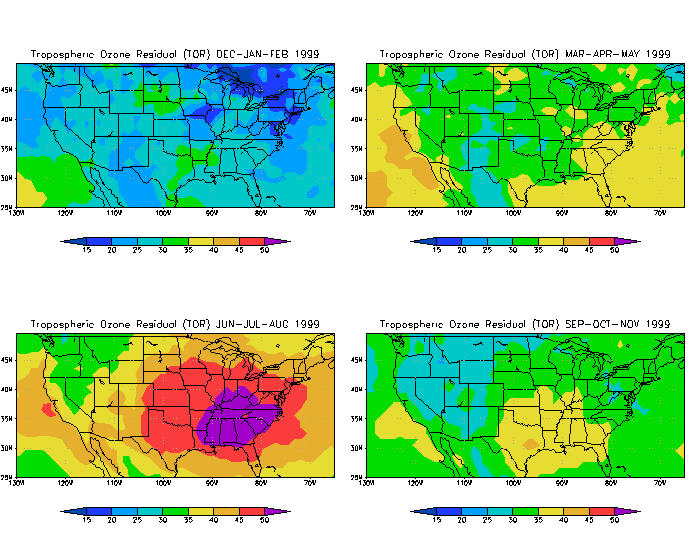
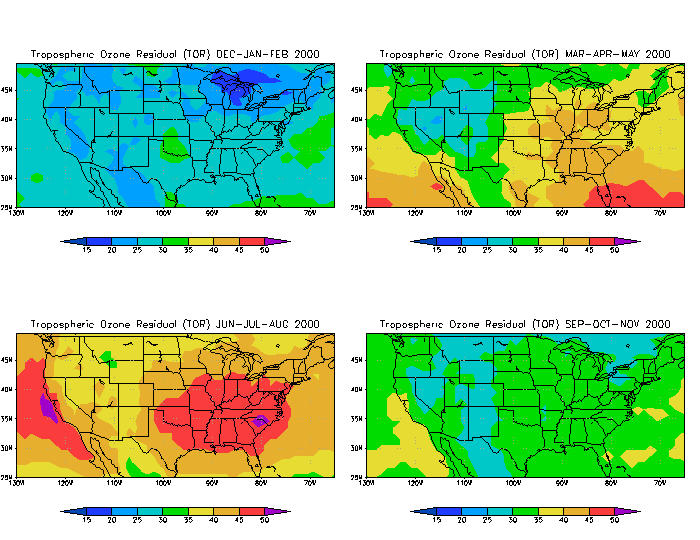
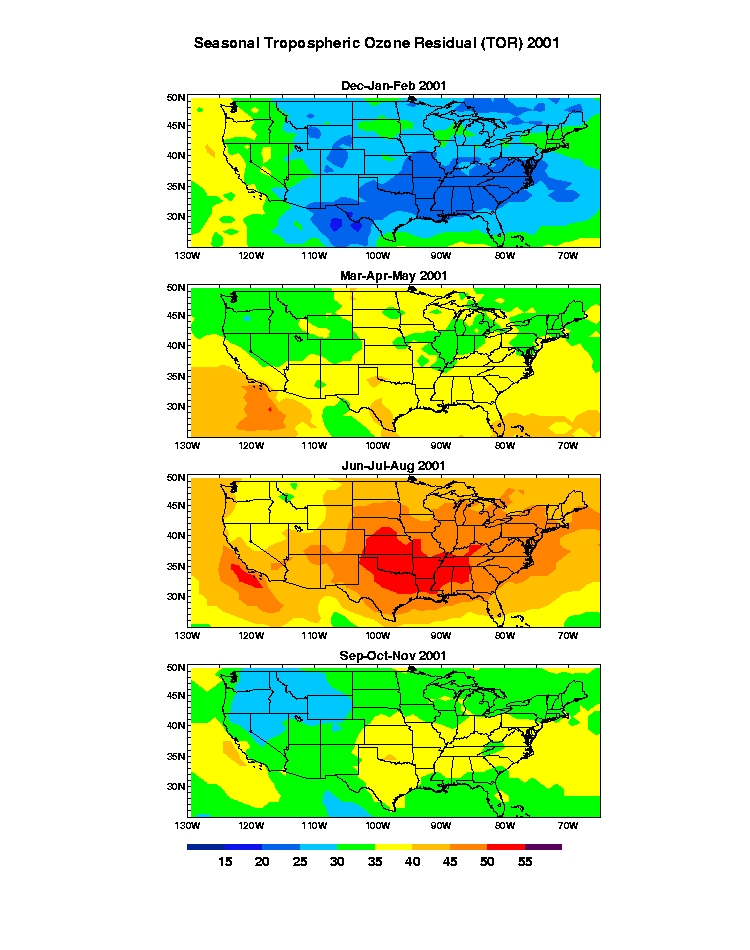
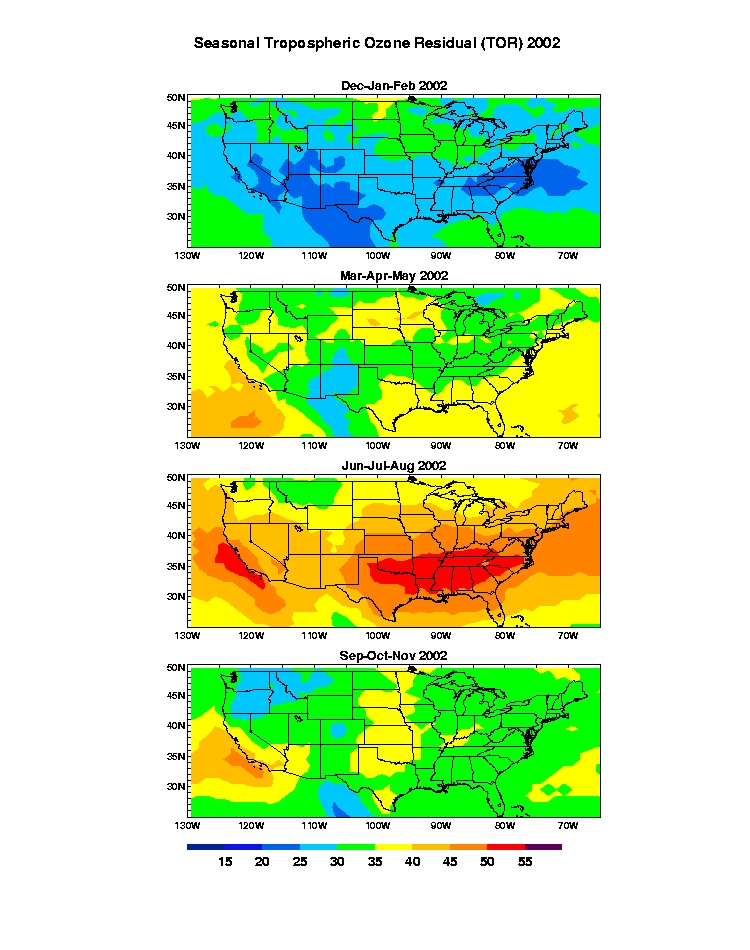
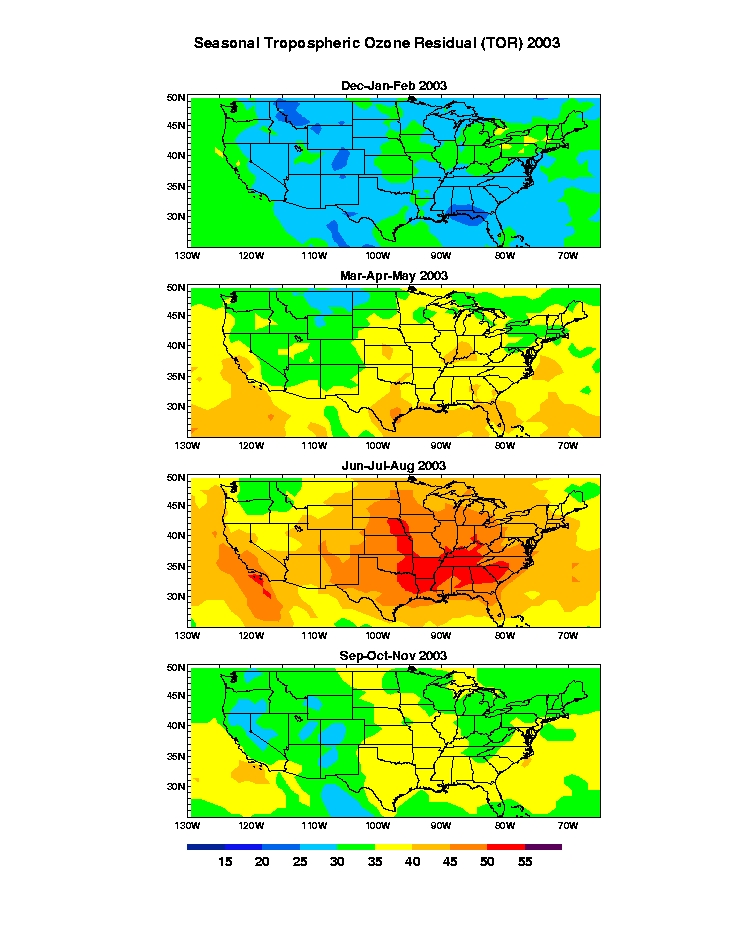
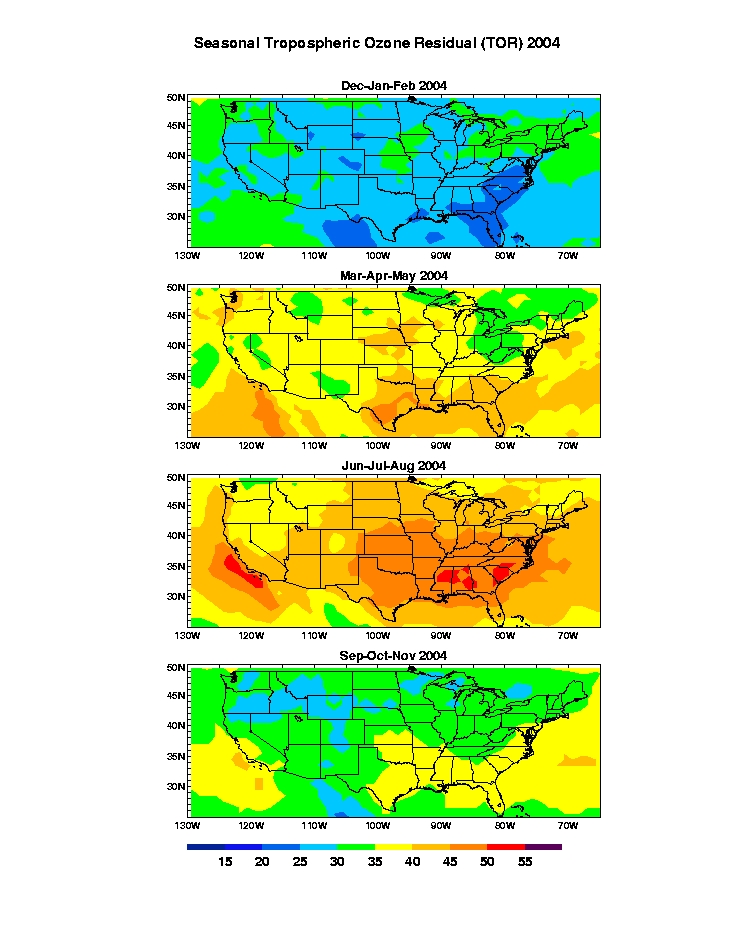
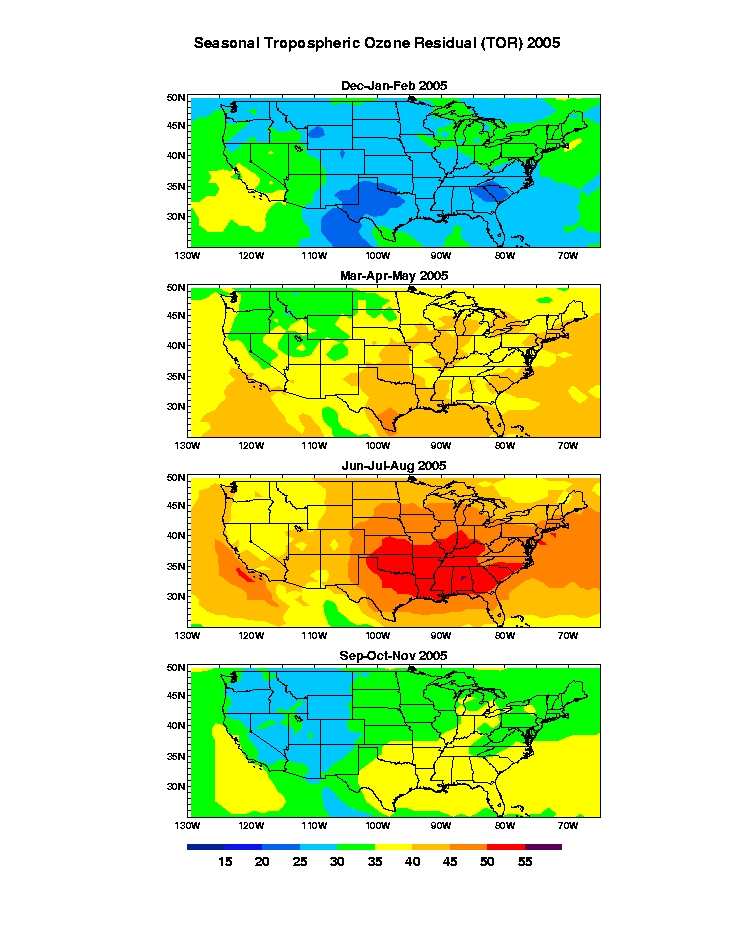
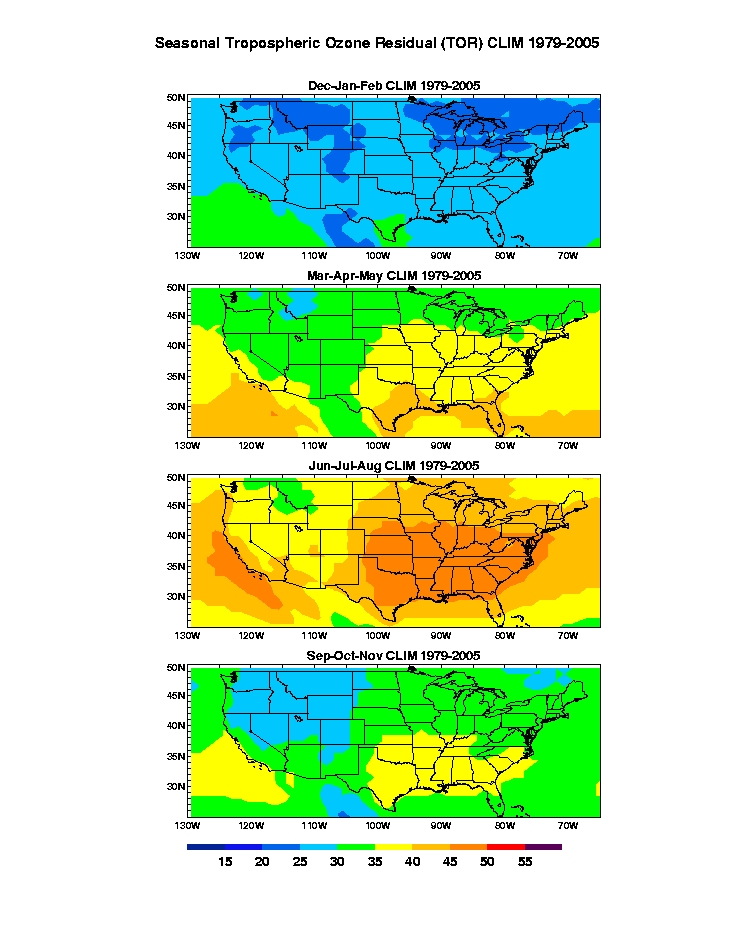
Data - TOMS/SBUV TOR IMAGES
Click on each year in the tables given below to view the respective image.
To save the image to your computer: right-click on the image and select "Save Image[Picture] As".
Global
United States
Acknowledgement:
- If you use any of the images given above, please include the following reference:
- Fishman, J., A.E. Wozniak, and J.K. Creilson, Global distribution of tropospheric ozone from satellite measurements using the empirically corrected tropospheric ozone residual technique: Identification of the regional aspects of air pollution, Atmos. Chem. Phys., 3, 893-907, 2003.
- Visit the Publications and Presentations page for a copy of this paper.
|
