|
|
|
History - Separation of Stratospheric Column Ozone from Total Ozone Measurements
The next step in the research was to find a method of separating the stratospheric component from the total ozone measurements.
Before that methodology was developed, however, an important analysis was provided in Fishman and Larsen [1987] where SAGE (Stratospheric Aerosol and Gas Experiment)
ozone profiles were used to calculate the amount of ozone in the stratosphere, or stratospheric column ozone (SCO).
Analysis of the SCO showed that the amount of stratospheric ozone at low latitudes was longitudinally independent.
On the other hand, TOMS total ozone measurements between 15°N and 15°S showed that the meridional distribution of
total ozone was quite different from the SCO distribution and that the difference between the total column and the
SCO was highly correlated with the total ozone measured by TOMS.
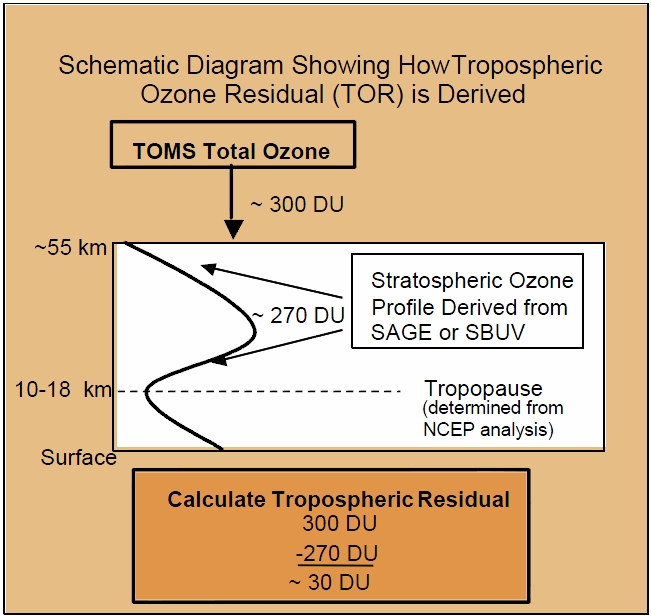
During the 1990s, our research group focused on trying to extract information about the troposphere from satellite
measurements by assuming that ozone variability in the stratosphere is defined on relatively large spatial scales
compared with the troposphere and that information could be obtained about the troposphere if this larger scale
stratospheric component could be isolated. Once the stratospheric ozone distribution has been established,
we can then examine the "residual" information contained in the TOMS total ozone measurements to infer information
about the troposphere (see Figure 4). The resultant distribution derived from this method was referred to as the "tropospheric ozone residual" (TOR).
The stratospheric ozone distribution that was subtracted from the concurrent TOMS total ozone measurement was first derived using co-located SAGE measurements.
SAGE has been providing ozone information since 1979 when it was first launched on the Atmospheric Explorer Mission 2 (AEM-2) satellite,
which functioned for nearly three years. In 1984, SAGE II was launched on the Earth Radiation Budget Satellite (ERBS) and provided measurements
21 years before being turned off in September 2005.
Using standard tropopause height information from the National Center for Environmental Prediction (NCEP) in conjunction with the SAGE profiles, Fishman et al.
[1990] demonstrated that a fairly accurate climatological depiction of tropospheric ozone could be obtained to include a domain that included
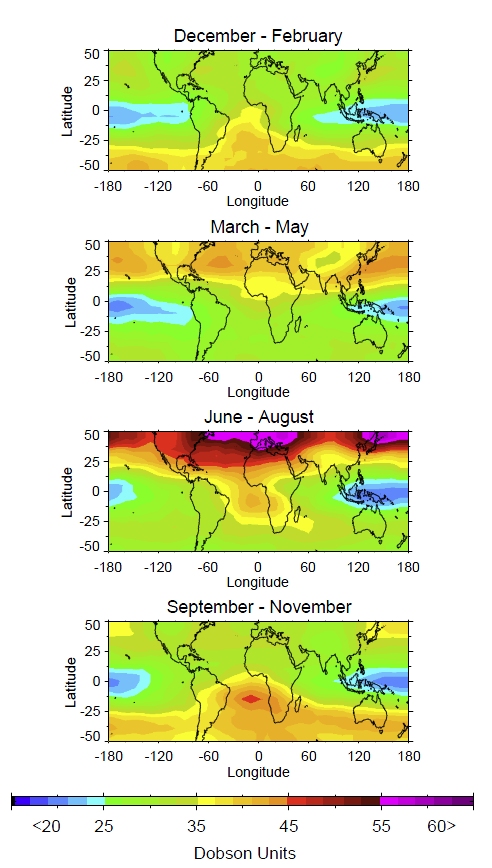
both the tropics and middle latitudes (~50° N to ~50° S). The seasonal climatology of the TOR is depicted in Figure 5 [Fishman et al., 1990]
and shows the elevated amounts of tropospheric ozone present in the middle latitudes during northern hemisphere summer; elevated TOR values are
also present in the tropics and subtropics in the southern hemisphere during austral spring (September-November), a consequence of widespread biomass
burning during that time of the year. This somewhat surprising finding in the South Atlantic became the focus of a major field campaign in 1992:
TRACE-A (Transport and Atmospheric Chemistry near the Equator-Atlantic; Fishman et al., 1996b).
|
