|
|
|
History - Scientific Findings from the TOMS/SBUV TOR Database
The unique attribute of our approach is the use of as many TOMS measurements as possible to derive a tropospheric product.
In simplest terms, a daily global distribution of the stratospheric component of total ozone is constructed which should
contain only large-scale structure. As a result, regional enhancements are significantly better resolved than in the
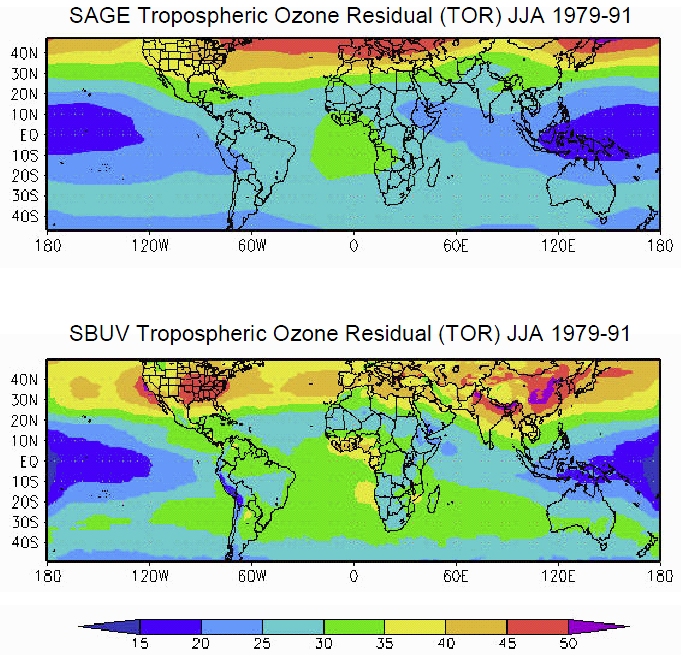
analyses derived using TOMS and SAGE (see Figure 7). In the June-July-August (JJA) NH summertime depiction, for example,
highest TOR values are located throughout the eastern United States and throughout eastern Asia.
Prominent high values are also seen emanating off the west coast of the United States as well as along the Ganges River
Valley in northeastern India.. In fact, the original TOMS/SAGE TOR over northwest India showed a relative minimum,
which was interpreted to be associated with the relatively higher elevations and lack of population in the Tibetan Plateau.
The greater detail in the present analysis shows a better-defined, relatively small region of low ozone over the higher elevations.
However, just south of that region in the Ganges River Valley, extending west of Delhi and eastward through Bangladesh and northern Burma,
much higher values of ozone are observed. High values are now seen throughout central and eastern China.
|
