
|
|
|
| Home | History | Research | Data | Publications | Contacts | Links |
|
History - Deriving TOR from TOMS and SBUV: The Empirical Correction
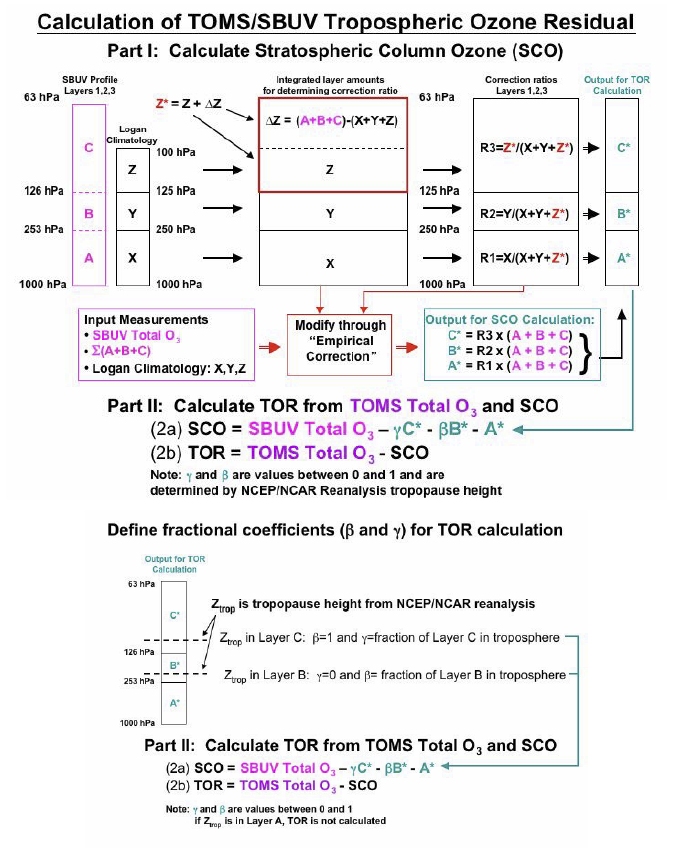
The TOR technique using SAGE data has generally been limited to climatological studies [e.g., Fishman et al., 1991; Fishman and Brackett, 1997]. A more rigorous analysis of the data indicates that the TOM/SAGE TOR is not useful to study tropospheric ozone variations at non-climatological scales because the TOMS/SAGE TOR is subject to sampling aliasing for periods of seasons or less, a consequence of the ~40-day period needed to obtain complete latitudinal coverage [Vukovich et al., 1996]. To achieve better temporal resolution, concurrent measurements from TOMS and SBUV (Solar Backscatter Ultraviolet) instruments have been used to derive daily TOR distributions. The procedure to derive the TOMS/SBUV TOR also uses knowledge of tropopause height obtained from gridded fields determined from the NCEP assimilation/modeling data base [Kalnay et al., 1996]. The grid that is used for the calculations is a 100 by 288 matrix, having a resolution of 1° latitude by 1.25° longitude and covering the region between the latitudes of 50° S to 50° N. In the region 50°S to 50°N, the SBUV instrument provides approximately 750 - 800 vertical profiles on a daily basis (SAGE, on the other hand provides ~30 vertical profiles per day). After the stratospheric ozone is determined at each grid point where SBUV data are available, an interpolation procedure is used to fill in all missing values within the daily matrix. A five-day running average is applied using the daily matrices of the SBUV stratospheric ozone and the resulting matrix is used to represent the stratospheric ozone distribution for the central day (i.e., day 3) used in the 5-day running average. The TOMS data, on the other hand, are not temporally averaged. The global TOMS/SBUV TOR distribution is determined for a given day by subtracting the 5-day running averaged SBUV stratospheric ozone data from the TOMS total ozone data at each grid point. Using this technique, the daily TOR were compared with data obtained from the TRACE-A field mission in 1992. In general, except when heavy aerosols were present due to widespread biomass burning, the TOR generally captured the spatial gradient of tropospheric ozone, but usually underestimated the magnitude of the gradient, and nominally captured only ~60% of the spatial difference between two points when compared with gradients determined from aircraft measurements [Fishman et al., 1996a]. Further analysis by Fishman and Balok [1999] found that the climatological distribution of the archived SBUV data was critically inaccurate in the lowest three levels of the atmosphere. In turn, these inaccurate values were the primary contributing factor to the poor agreement found between the TOMS/SBUV TOR distributions and the TOMS/SAGE TOR noted by Vukovich et al. [1997]. After analyzing thousands of soundings from more than 20 ozonesonde stations, Fishman and Balok employed an empirical correction to the archived SBUV measurements to derive stratospheric integrals that could be subtracted from the concurrent TOMS observations. These data were then used to characterize the development of an air pollution episode over the eastern United States. As part of our research, we have developed monthly distributions of TOR fields using concurrent measurements from TOMS and SBUV instruments. Initially, the use of archived SBUV profiles had been shown to result in inaccuracies in layer amounts below the stratospheric ozone peak [Vukovich et al., 1996; Ziemke et al., 1998]. However, through the use of an empirical correction applied to the lowest three SBUV archived layers [Fishman and Balok, 1999], a global TOR dataset that greatly enhances the regional detail that can be obtained using the bounty of the TOMS total ozone database [Fishman et al., 2003] is available. This methodology has used empirically corrected SBUV data (see Figure 6) to derive the amount of ozone in the stratosphere, a quantity called stratospheric column ozone (SCO) which is computed daily and then subtracted from the concurrent measurement of total ozone derived from TOMS. |
|
|