| LITE Directory | |
| Home Page | |
| Mission Overview | |
| Data User's Guide | |
| Data FAQ's | |
| Science Steering Group | |
| Instrument | |
| Publications | |
| Images | |
| Photos | |
| Photos and Images | |
| Data Gallery | |
| Meta Data | |
| ISDB Data |
| SELECT AN ORBIT | ||||
| 355 nm
|
5 5 5 | 6 6 6 | 13 13 13 | |
| 14 14 14 | 15 15 15 | 22 22 22 | ||
| 23 23 23 | 24 24 24 | 27 27 27 | ||
| 28 28 28 | 32 32 32 | 33 33 33 | ||
| 34 34 34 | 35 35 35 | 45 45 45 | ||
| 47 47 47 | 48 48 48 | 50 50 50 | ||
| 53 53 53 | 54 54 54 | 55 55 55 | ||
| 60 60 60 | 66 66 66 | 71 71 71 | ||
| 72 72 72 | 73 73 73 | 74 74 74 | ||
| 75 75 75 | 78 78 78 | 79 79 79 | ||
| 80 80 80 | 81 81 81 | 82 82 82 | ||
| 83 83 83 | 84 84 84 | 85 85 85 | ||
| 87 87 87 | 103 103 103 | 104 104 104 | ||
| 105 105 105 | 113 113 113 | 115 115 115 | ||
| 116 116 116 | 117 117 117 | 118 118 118 | ||
| 119 119 119 | 122 122 122 | 123 123 123 | ||
| 124 124 124 | 125 125 125 | 127 127 127 | ||
| 128 128 128 | 129 129 129 | 131 131 131 | ||
| 133 133 133 | 134 134 134 | 135 135 135 | ||
| 136 136 136 | 137 137 137 | 141 141 141 | ||
| 145 145 145 | 146 146 146 | 147 147 147 | ||
| 148 148 148 | 149 149 149 | 150 150 150 | ||
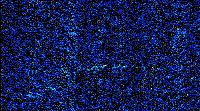
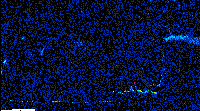
LITE Images for 355 nm Wavelength - Orbit 50
Following each group of scaled color-modulated plots are two tables. The first table contains the Begin and End GMT, MET, Latitude, and Longitude for each plot. The second table contains the Modes of Operation Summary for the orbit.
Full size color-modulated plots (includes annotated horizontal and vertical axis and color scale) may be displayed by clicking-on the scaled image or by clicking-on the image number in the first table.
Measurement Locations for LITE - Orbit 50
| Image Description | |||||
|---|---|---|---|---|---|
| Image | GMT | MET | Latitude | Longitude | |
| 1 | Start | 255/23:35:08.3 | 003/01:12:13.3 | 6.26 | -131.21 |
| - | End | 255/23:36:48.2 | 003/01:13:53.2 | 11.87 | -127.89 |
| 2 | Start | 255/23:36:48.3 | 003/01:13:53.3 | 11.87 | -127.89 |
| - | End | 255/23:38:22.9 | 003/01:15:27.9 | 17.13 | -124.58 |
| 3 | Start | 255/23:45:10.1 | 003/01:22:15.1 | 38.39 | -106.99 |
| - | End | 255/23:46:50.0 | 003/01:23:55.0 | 43.12 | -100.99 |
| 4 | Start | 255/23:46:50.1 | 003/01:23:55.1 | 43.13 | -100.98 |
| - | End | 255/23:48:30.0 | 003/01:25:35.0 | 47.37 | -94.08 |
| 5 | Start | 255/23:48:30.1 | 003/01:25:35.2 | 47.38 | -94.08 |
| - | End | 255/23:49:25.9 | 003/01:26:31.0 | 49.52 | -89.73 |
LITE Level 1 data, Images Updated: September 1998
