| LITE Directory | |
| Home Page | |
| Mission Overview | |
| Data User's Guide | |
| Data FAQ's | |
| Science Steering Group | |
| Instrument | |
| Publications | |
| Images | |
| Photos | |
| Photos and Images | |
| Data Gallery | |
| Meta Data | |
| ISDB Data |
| SELECT AN ORBIT | ||||||
| 532 nm | ||||||
| 24 | 32 | 33 | 34 | 35 | 45 | 47 |
| 48 | 50 | 53 | 54 | 55 | 60 | 66 |
| 72 | 73 | 74 | 75 | 78 | 79 | 80 |
| 81 | 82 | 84 | 85 | 87 | 104 | 105 |
| 113 | 115 | 116 | 117 | 118 | 147 | . |
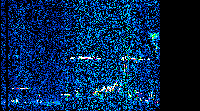
LITE Photographs and Daytime Images for 532 nm Wavelength - Orbit 72
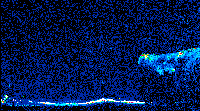
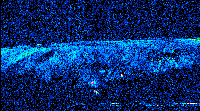
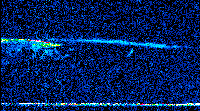
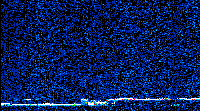
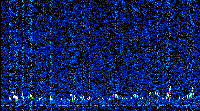
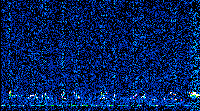
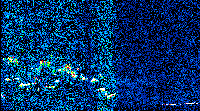
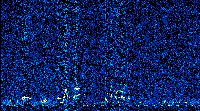
Following each group of scaled color-modulated plots is a table listing the Begin and End GMT, MET, Latitude, and Longitude for each plot.
Full size color-modulated plots (includes annotated horizontal and vertical axis) with corresponding LITE photographs may be displayed by clicking-on the scaled image or by clicking-on the image number in the table.
The LITE color images and photographs are along the daytime (red) measurement locations for Orbit 72
| Image Description | |||||
|---|---|---|---|---|---|
| Image | GMT | MET | Latitude | Longitude | |
| 1 | Start | 257/09:30:07.7 | 004/11:07:12.8 | -54.70 | -45.20 |
| - | End | 257/09:31:47.6 | 004/11:08:52.7 | -56.40 | -34.25 |
| 2 | Start | 257/09:31:47.7 | 004/11:08:52.8 | -56.40 | -34.24 |
| - | End | 257/09:33:27.6 | 004/11:10:32.7 | -56.98 | -22.59 |
| 3 | Start | 257/09:33:27.7 | 004/11:10:32.8 | -56.98 | -22.57 |
| - | End | 257/09:35:07.6 | 004/11:12:12.7 | -56.35 | -10.93 |
| 4 | Start | 257/09:35:07.7 | 004/11:12:12.8 | -56.34 | -10.92 |
| - | End | 257/09:36:47.6 | 004/11:13:52.7 | -54.59 | 0.01 |
| 5 | Start | 257/09:36:47.7 | 004/11:13:52.8 | -54.58 | 0.02 |
| - | End | 257/09:38:27.6 | 004/11:15:32.7 | -51.87 | 9.77 |
| 6 | Start | 257/09:38:27.7 | 004/11:15:32.8 | -51.86 | 9.78 |
| - | End | 257/09:40:07.7 | 004/11:17:12.7 | -48.39 | 18.26 |
| 7 | Start | 257/09:40:07.8 | 004/11:17:12.8 | -48.38 | 18.27 |
| - | End | 257/09:41:47.7 | 004/11:18:52.7 | -44.30 | 25.50 |
| 8 | Start | 257/09:41:47.8 | 004/11:18:52.8 | -44.30 | 25.51 |
| - | End | 257/09:43:27.6 | 004/11:20:32.7 | -39.77 | 31.69 |
| 9 | Start | 257/09:43:27.8 | 004/11:20:32.8 | -39.76 | 31.70 |
| - | End | 257/09:45:07.7 | 004/11:22:12.7 | -34.90 | 37.02 |
| 10 | Start | 257/09:45:07.8 | 004/11:22:12.8 | -34.90 | 37.02 |
| - | End | 257/09:46:47.7 | 004/11:23:52.7 | -29.80 | 41.72 |
| 11 | Start | 257/09:46:47.8 | 004/11:23:52.8 | -29.80 | 41.72 |
| - | End | 257/09:48:27.6 | 004/11:25:32.7 | -24.51 | 45.92 |
| 12 | Start | 257/09:48:27.8 | 004/11:25:32.8 | -24.50 | 45.92 |
| - | End | 257/09:50:07.7 | 004/11:27:12.7 | -19.05 | 49.74 |
| 13 | Start | 257/09:50:07.8 | 004/11:27:12.8 | -19.05 | 49.74 |
| - | End | 257/09:51:47.7 | 004/11:28:52.7 | -13.50 | 53.28 |
| 14 | Start | 257/09:51:47.8 | 004/11:28:52.8 | -13.49 | 53.29 |
| - | End | 257/09:53:07.2 | 004/11:30:12.2 | -9.05 | 55.96 |
LITE Level 1 data, Images Updated: September 1998
